We will discuss existing projects that have been carried out with this technology, focusing on the data used, and how the geospatial SQL helps provide added value. We will also look at possible ways to enrich the projects, using the BBVA Data API, and other sources of open data
In this post, we will discuss the Viewer of Archaeological Routes in the city of Cordoba, created by the geo division at Almagre, which is a consultancy firm specializing in services based on geographic information systems.
The viewer makes it possible, in a simple and user-friendly way, to visit a total of 79 representative points in the city of Cordoba, from an archaeological standpoint.
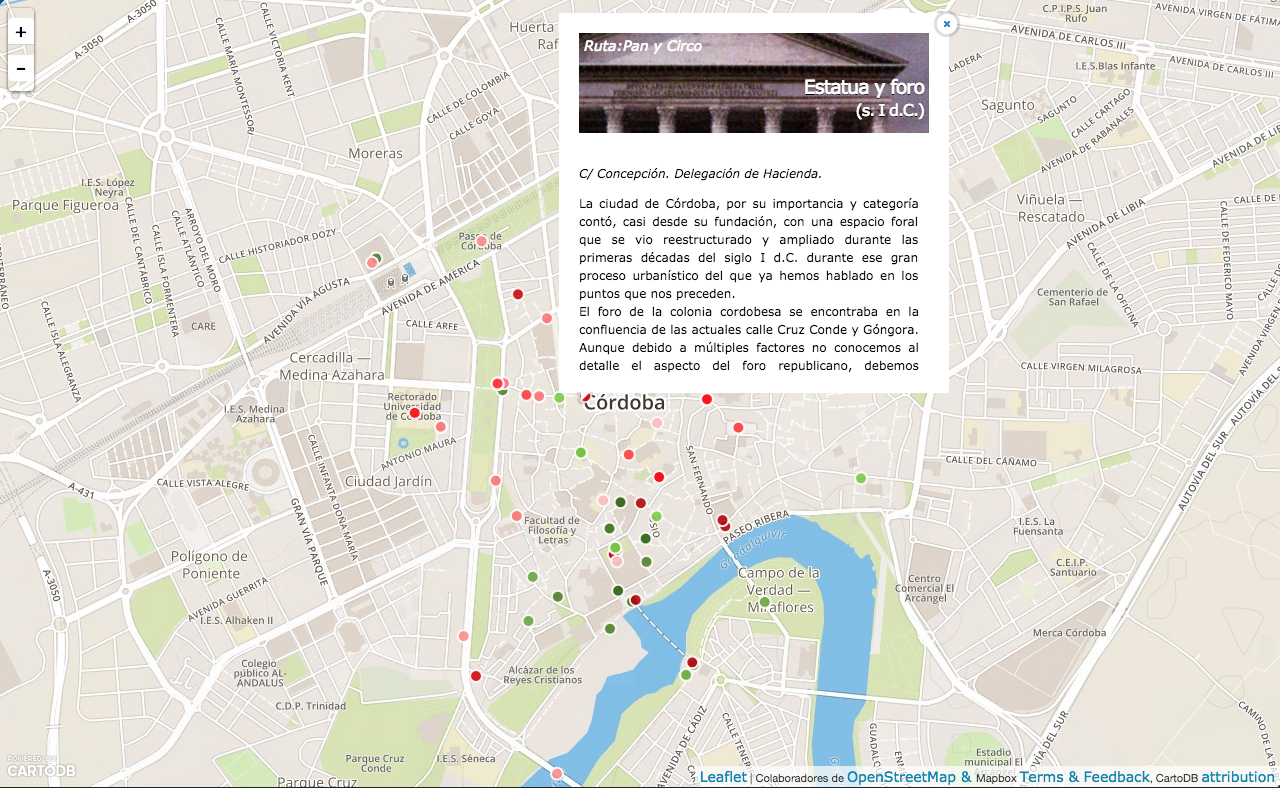
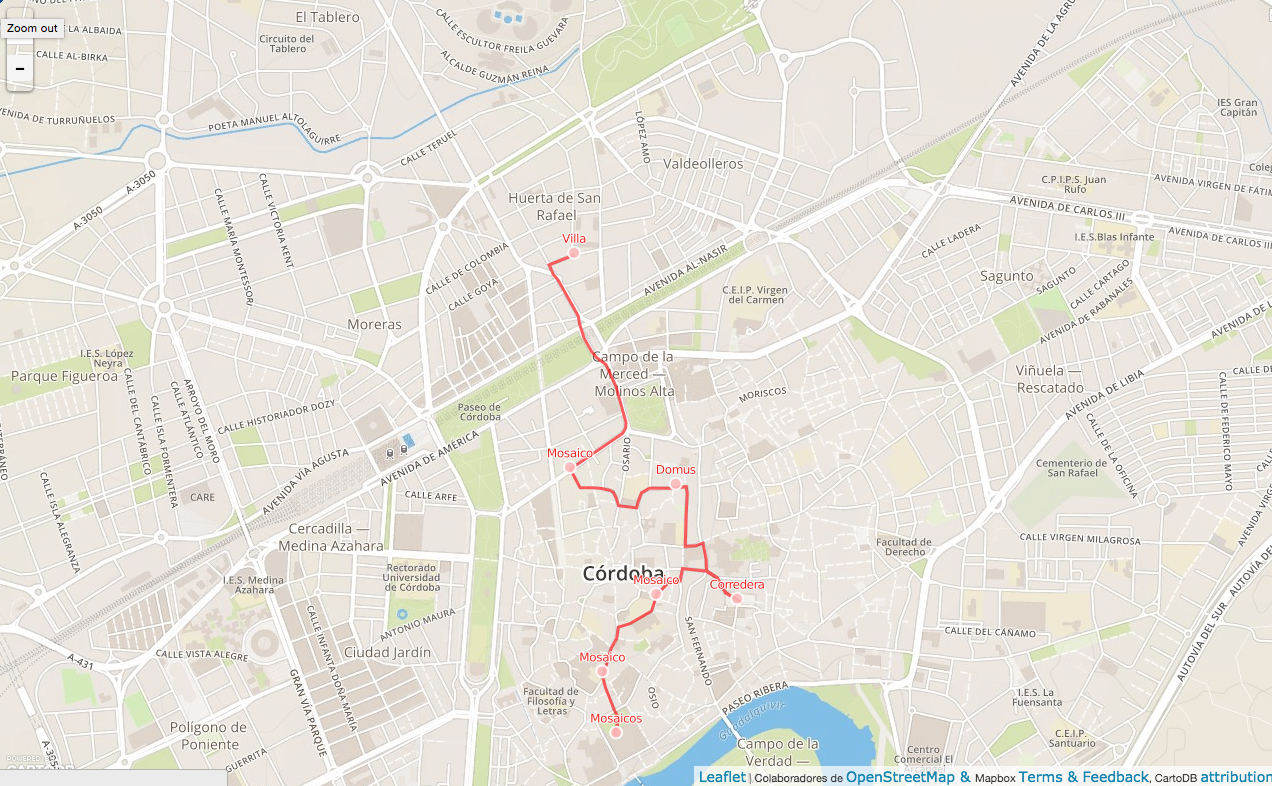
We can also reproduce some of the thematic routes that the Sisifo Research Group, from the University of Cordoba, has been creating since 2011
We will now look at a short analysis of the data model used to implement these features as well as some simple snippets of geospatial SQL code used to create routes between points.
Data model
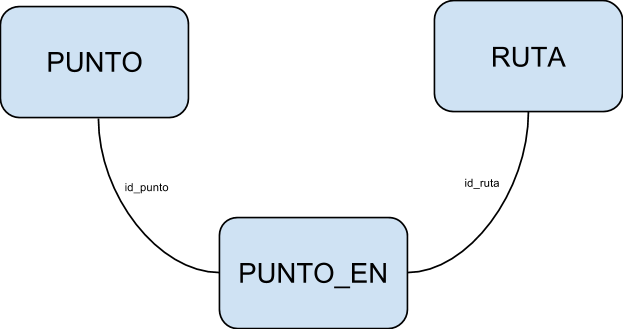
Without going into specific particularities on this project’s implementation, we can summarize its data model in 3 logical entities:
– Point entity: contains a geographical point of interest, along with its associated information
– Route entity: contains a line, geographically located in a particular area, between a start and end point
– Point_en entity: This is the glue between the above entities. Basically, it contains references to points together with the route they belong to. therefore, one route will have several points, and one point can belong to the various routes
These logical entities are mapped to physical entities in the CartoDB data store. These physical entities are nothing more than tables within the PostgreSQL database manager.
Relationships are seen between existing entities in the following diagram
As for the physical implementation of the data model, we could do this by using the statement CREATE TABLE, from PostgreSQL, in our installation of PostgreSQL / local PostGIS. But since we are working with CartoDB, we have an interface at our disposal that allows us to perform this operation easily with a few mouse clicks.
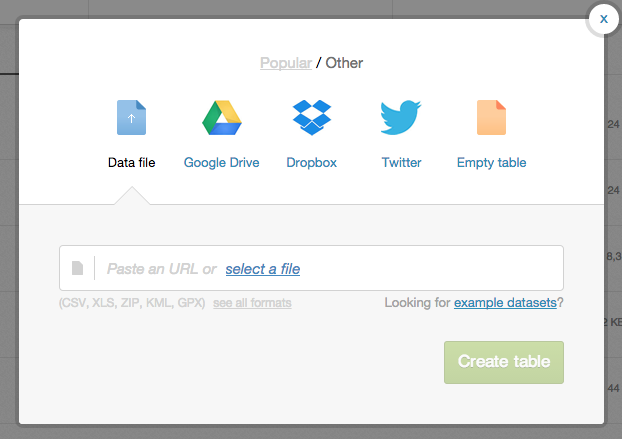
We start by going into our CartoDB account (click here to get a free CartoDB account), go to the dashboard, and add a new table, using the create table button that looks like this

It can be seen that we have several options. Choose Empty table
That will create a table without a name, which we can subsequently rename by simply double clicking on its title and adding any name we want. For example, points (puntos)

Once that has been done, a table will be created with a set of default fields. Fields that will suffice for the purposes of our example to create a table of points with associated information:

We will do the same with our line table. The steps are the same as in the previous example, but this time, we name the created table routes (rutas)
Finally, we should create a third table to store the relationship between points and routes, and allow:
– a point to belong to different routes in the routes table
– a route to use various points from the points table
However, to simplify this example, we will work exclusively with the points and routes tables. They will be sufficient to create a sample route in a simple way, as we will see below
Connecting our points
We can now start adding points and routes to our tables. We will begin with the points
Adding points in the points table
As the wizard itself tells us, there are two ways in which we could start adding points:
– By clicking on the + symbol to the left of the first row
– By using the Add Row button, from the the menu on the right-hand side
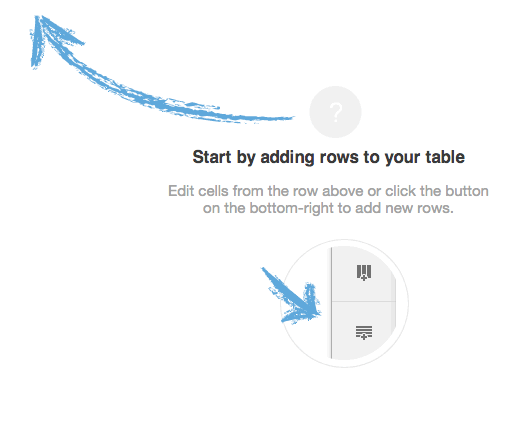
However, there is a third way, which in our case is what we will use as it is quicker:
– Add several points at once through an SQL statement
To do this, we will write an SQL statement in the console available in the menu on the right-hand side
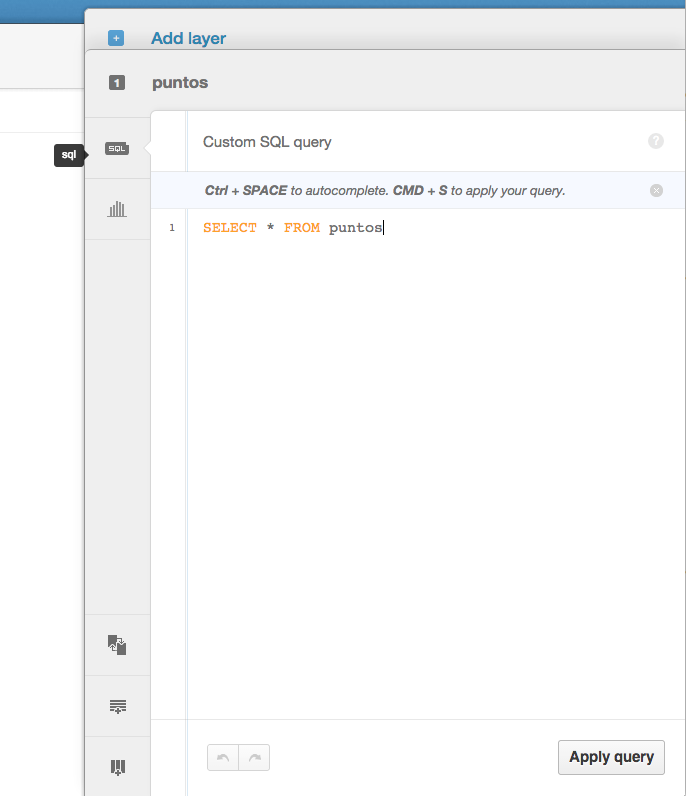
In this console we can write the following statement INSERT, which will add several points at once
INSERT INTO puntos(the_geom, name, description) VALUES ('0101000020E61000008CEF51A0CB1713C06E31C36F58F04240', 'Punto 1', 'Punto 1 de la ruta'),
('0101000020E6100000B32B46C0951E13C0443BE104AAF04240', 'Punto 2', 'Punto 2 de la ruta'),
('0101000020E6100000F3D71A00602313C02BE5EFBD43F14240', 'Punto 3', 'Punto 3 de la ruta'),
('0101000020E61000002C2E2BA0922313C027E5C5F44AF14240', 'Punto 4', 'Punto 4 de la ruta'),
('0101000020E61000001B134120C01B13C058B9823399F14240', 'Punto 5', 'Punto 5 de la ruta'),
('0101000020E61000001E322760221F13C011142629BCF14240', 'Punto 6', 'Punto 6 de la ruta'),
('0101000020E610000086012AA0791E13C0958CCEBFFEF14240', 'Punto 7', 'Punto 7 de la ruta')
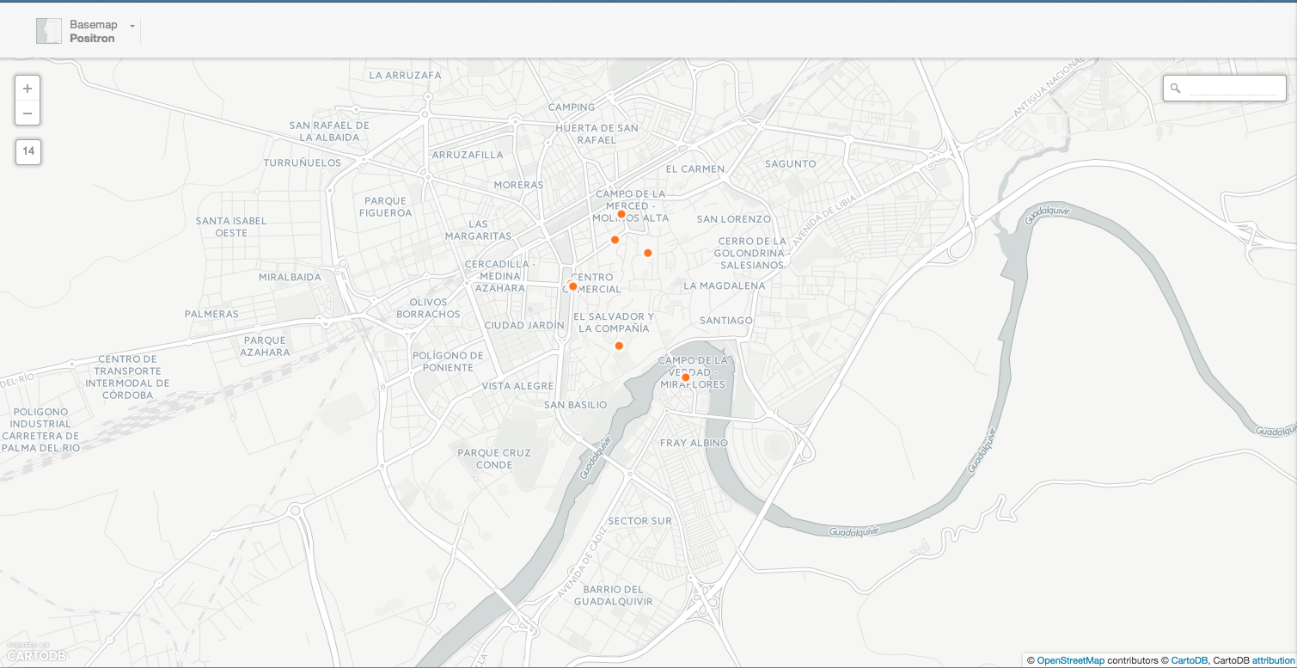
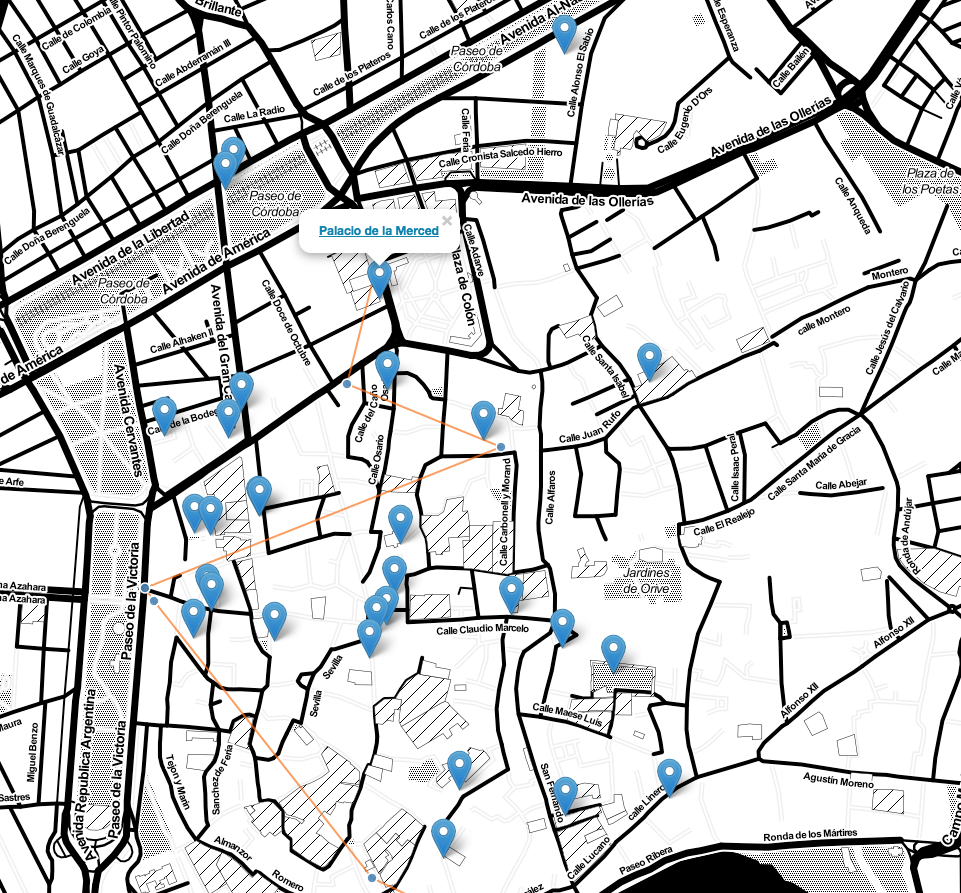
Since we have some points on the map, we can see them directly from the map view from our table:

These are our points in the city of Cordoba, from the CartoDB map view
Adding lines in our routes table
We are now going to fill in our routes table. To do this, we take advantage of the points already created, and draw a line through all of them, through another SQL statement.
Basically, we will use the PostGIS command ST_MakeLine to create a line from a set of points. The statement is as follows:
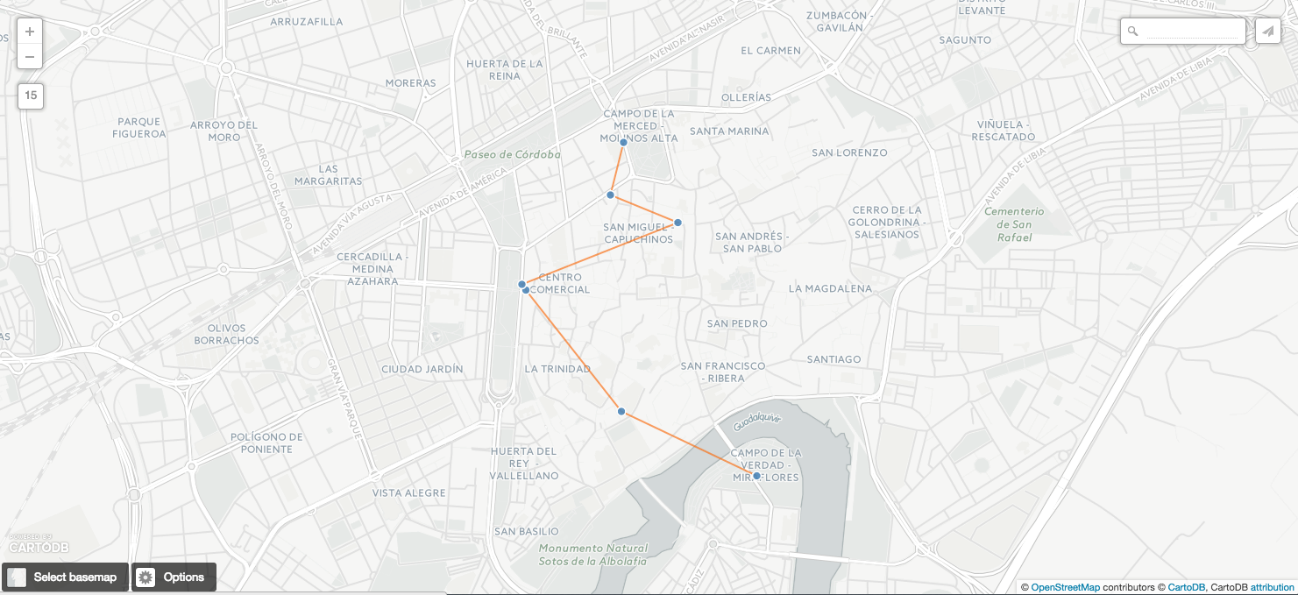
insert into rutas(the_geom, name, description) select st_makeline(the_geom), 'Ruta 1', 'Esta es la ruta 1' from puntos
With this query, we create a line in the routes table that follows all points from the points table. It can be seen in the following screenshot that the line does indeed pass through all the points, forming a route
It should be highlighted that we have used a small trick in creating this route. This may be obvious to a reader who is familiar with PostGIS geospatial functions; however, it is worth mentioning.
In creating the route, we used the aggregate version of the PostGIS ST_MakeLine function. The aggregation concept in the context of a function means that the function takes a set of elements as an argument rather than only one. In our example, this set is nothing more than all points from our points table.
The trick is in the order in which we obtain those points. For ST_MakeLine to be able to work with a set of points, these points need to be sorted by their spatial position. Therefore, the line will be drawn naturally. In our case, when we insert points, we are already inserting them in order to avoid having to specify ORDER BY in the subsequent SELECT query. Consequently, the line goes through all points without skipping any.
We could have added our points manually by selecting “Add feature”, available in the map view on the bottom right. It is represented by this icon:

The only restriction is that we have to add them in order to be able to make the call to ST_MakeLine in the way we have done. Otherwise, we would have to sort the points by executing the SELECT query, as already mentioned.
Thus, by using a pair of simple SQL statements, we have built a basic system creating routes through predefined points. The next steps would be to:
– Enrich the information that can be obtained upon clicking on one of the points
– Offer a menu to easily view the routes
Although, as discussed below, it would also be possible to enrich an application like adding new external data sources.
Expanding the project: API BBVA
Now that we know how to build a basic system of points of interest and routes that connect these points, let’s see how to enrich the application by obtaining third-party data.
Specifically, we could add data about purchases made with credit cards in areas near points of interest. It might serve, for example, to generate an additional layer containing a choropleth map that accounts for costs in certain interesting categories. For example:
– We want to find out the expenses incurred in bars and restaurants around the points marked on the route. Consequently, we could identify, for example, if there is a point where it would be of interest to open food establishments, because of their proximity to a point of archaeological interest, which would be a potential source of tourism.
– We want to find out the expenses incurred on fuel around the points of interest furthest away from the city center. That way, we would identify the need for gas stations in some areas.
It would be quite simple to add a layer of this nature. In a previous post, we learned how to read data from the BBVA API and load them into a CartoDB table. With the data loaded in CartoDB, it is is extremely easy to add another layer to our visualization.
Of course, we are not just limited to working from within the CartoDB platform, loading data into a table. We can also integrate data directly from the BBVA API in our web applications created with CartoDB.js. We can load existing layers into our CartoDB account, while at the same time adding markers with data from the BBVA API in JSON format.
In this particular case, we do not have any data pertaining to the BBVA API of the area that interests us (Cordoba), but the aforementioned examples are illustrative of the intention pursued.
Expanding the project: Other APIs
Of course, our project can be further expanded by using other data sources. A source that is especially interesting to combine with the BBVA Data API is the Foursquare API. This is because data can be added to the information on expenses incurred with cards relating to the establishments where these card payments were possibly made.
In our particular case, information is available in Foursquare on the Cordoba area. For example, we can make a request for establishments near to point 1 of our route (the link above requires authentication with Foursquare).
It is very easy to create a web application using the CartoDB API, while at the same time integrating points of interest from Foursquare. A basic example is provided at this link. Simply enter your Foursquare CLIENT_ID and CLIENT_SECRET. Explaining how to do it is outside the scope of this article, but more information can be obtained at the Foursquare developer website.
A screenshot of what this application looks like is shown below
If you are interested in the world of APIs, find out more about BBVA’s APIs here.