Data visualization has exploded. It is no longer necessary know about IT tools like the Adobe suite or to be able to program with JavaScript (to create charts with libraries such as D3.js), Python (data mining) and R (data science and statistics) to make good charts and help the reader understand complex information. Today there is a vast toolbox available within the world of data visualization. Two examples are the simple Datawrapper or the more complex Tableau.
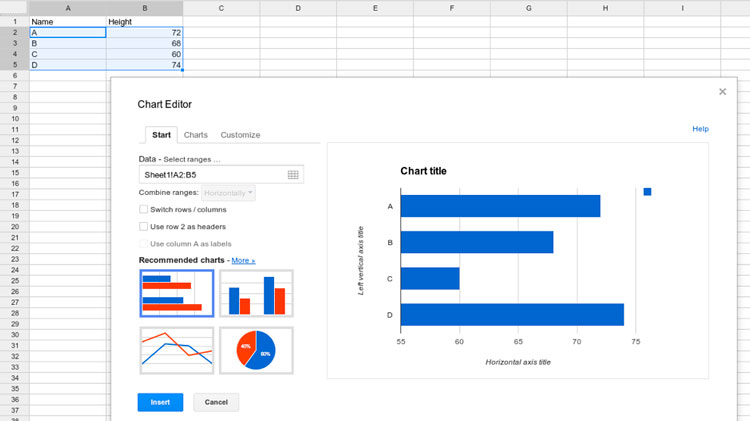
Tools that require a degree of technical knowledge include the combination of Google Spreadsheets the –big search engine’s Excel sheet–, and jQuery, the JavaScript open code library which has changed the way we add interactivity to web pages. Thanks to both it is now possible to create interactive charts that are updated dynamically as the data change. Two essential requirements.
Google Spreadsheets has a clear advantage when handling and structuring the data to make visualizations: It enables large volumes of information to be exported in easy-to-handle formats such as JSON and XML. Once data is available in these formats, it is easy to access them via the website (through a URL) and handle them via a library in JavaScript for to represent them graphically if you know how to program in code. The only requirement is for the data table to be public on the web, an option that can be selected in the advanced settings of Google Spreadsheets.
A table with five rows and two columns in the JSON format would look similar to this, showing the best paid actors in 2015 as the content. In this tutorial we look at some of the keys for visualizing this information. In the end, when the Google spreadsheet and the data table is posted on the website, accessing the data through a URL is as simple as changing the document ID for the word SPREADSHEET via this link:
https://spreadsheets.google.com/feeds/list/SPREADSHEET/od6/public/basic?alt=json
AJAX methods to obtain data
The jQuery.get() method allows the data to be loaded using an AJAX function through a HTTP GET request. This collects the information for the final visualization via a URL (in this case, the one we have seen). The method follows this structure: jQuery.get( url [, data ] [, success ] [, dataType ] ).
In this definition, URL is where the request is sent, and is obligatory; data is the object or the data chain sent to the server with the request, and is optional; success callback is a function to call back the response if the HTTP GET request is successful; and dataType is the type of data requested from the server in the HTTP request (either XML, JSON, script, text, html…).
The AJAX function code with jQuery would be something like this:
.ajax({
url: url,
data: data,
success: success,
dataType: dataType
});
Within this $.get method, there are two that are even more specific:
– $.getScript: add a script to the page.
– $.getJSON: make a HTTP GET request to the URL to obtain the data contained there in JSON format. This method is widely used to extract information that is then used to make all kinds of charts.
In the case of using a jQuery.get() method to obtain the data, the code would be: var spreadsheetId = “ID”,
url = “url”;
$.get({
url: url,
success: function(response) {
console.log(response);
}
});
Some libraries for visualizing data
Once the information has been extracted from a Google spreadsheet through a public URL using a HTTP GET request with jQuery, the only thing you need to do is load some of the data visualization libraries in the code of your future page, restructure the information and give it styles through CSS. Some of the libraries that can be used have great chart options.
– FusionCharts: this is a JavaScript library with over 90 different types of charts and more than 1,000 maps. It has over 24,000 customers in more than 120 countries. FusionCharts has open-code plugins to make them compatible with other JavaScript libraries such as jQuery, development brands like AngularJS or ReactJS and other programming languages like PHP or ASP.NET.
– Google Charts: the search engine has its own library to make data visualizations. It has a wide variety of charts, ranging from fever and bar chart visualizations to scatter charts. Of course, you can customize the styles in each visualization by changing the colors or sizes, to give just two examples. No plugins are required to adapt to the different browsers or platforms such as iOS or Android. The library will function with HTML 5 and the SVG format. The data can be connected in real time to make them dynamic.
The JavaScript code to load the library in the <head> of the HTML:
<script type=”text/javascript” src=”https://www.gstatic.com/charts/loader.js“></script>
<script type=”text/javascript”>
google.charts.load(‘current’, {packages: [‘corechart’]});
google.charts.setOnLoadCallback(drawChart);
</script>
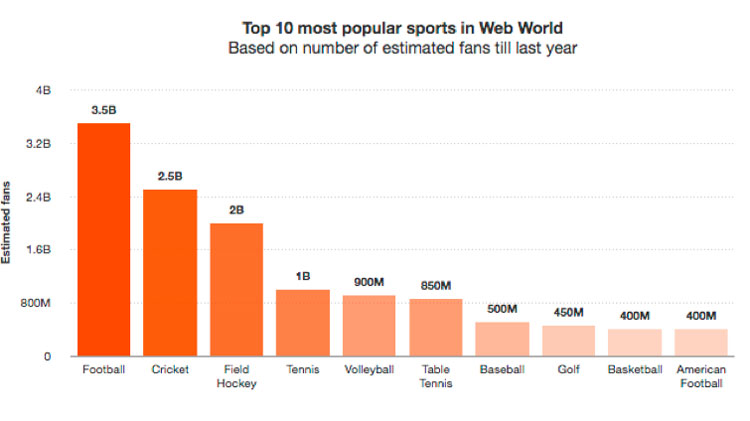
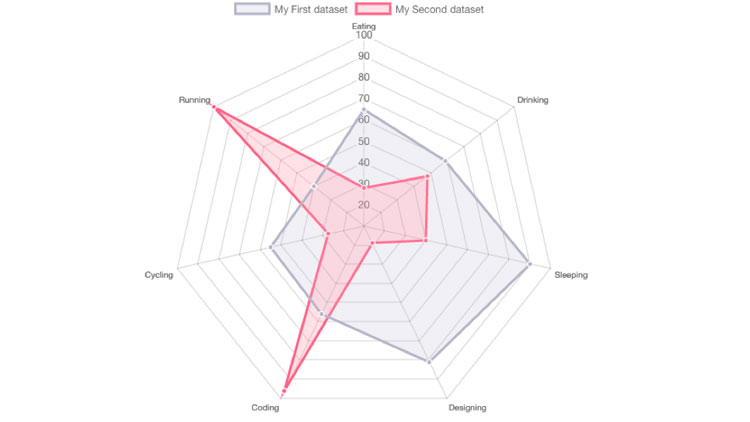
– Charts.js: this is a JavaScript library with fewer chart types (at the moment it has eight different visualizations: line, bar, radar or pie charts, among others). This is an opensource project with all the code available on GitHub, the collaborative development platform. This allows programmers to complete and improve the library with new features without any problem. Chart.js works with HTML5, like all the most modern navigators, and is totally responsive.
The library can be loaded on the page HTML in two ways:
<script src=”Chart.js”></script>
<script>
var myChart = new Chart({…})
</script>
Or else as follows:
// Using CommonJS
var Chart = require(‘src/chart.js’)
var myChart = new Chart({…})
// ES6
import Chart from ‘src/chart.js’
let myChart = new Chart({…})
// Using requirejs
require([‘path/to/Chartjs’], function(Chart){
var myChart = new Chart({…})
})
If you want to try BBVA’s APIs, test them here.