Data science has become one of the fastest growing fields in companies. Certain elements of data usage such as visualizing complex information to extract conclusions and improve business decision-making offer a wealth of professional opportunities. In this field the programming languages Python and R are ahead of the pack. If you have statistical information and you want to understand it, this syntax can help you.
R is an open-code programming language created in 1995 by Ross Ihaka and Robert Gentleman to improve the visualization and data analysis features of a prior syntax such as S. R is an evolution of S. Today many users and professionals who use R come from the world of statistics or mathematics, applied to sectors such as healthcare. Other professionals are slowly beginning to see the advantages of R for understanding complex information and improving decision-making.
Python is a syntax that has its origins in 1991, when it was created by Guido Van Rossem in order to make an agile and simple programming language with a very steep learning curve. This is a great advantage for growing the use of the syntax internationally. Since its beginnings it was aimed at professionals from the world of statistics, but its features have significantly broadened Python’s field of use: it is now used to create graphics with big data. More and more companies are adding Python programmers to both their back-end and front-end teams.
This language is a highly intuitive general-purpose syntax: any developer who takes a little time to learn it can then create innovative products that make good use of its great flexibility. This makes it a fun and versatile language for programmers.
The greatest benefits of Python and R
● A large number of repositories in GitHub:
GitHub is one of the world’s largest collaborative development pages. Most programmers use this website to reuse open-code projects for their own initiatives. This means it serves as an effective thermometer for measuring the community supported by each programming language and the muscle that keeps the evolution of each syntax alive.
In the case of R, GitHub has over 43,000 repositories and Python, more than 91,000. They come after with more activity: over 230,000 project repositories in JavaScript; 196,000 in Ruby; and 162,000 initiatives in Java. They are followed by other well-known syntaxes such as HTML, PHP, CSS, C++ and C#.
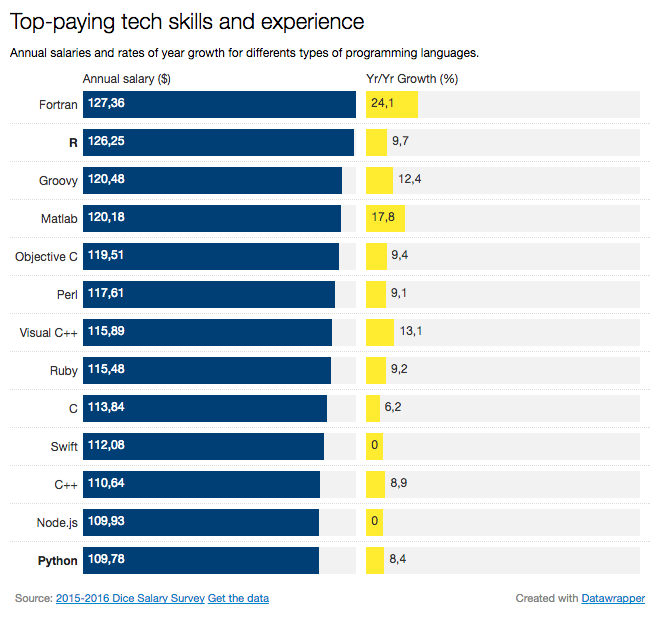
This is not the only reference frequently used to compare the value of programming languages among the community of developers and companies when embarking on projects. Once a year, Dice conducts a survey to rate certain elements related to programming syntax, technology profiles and their salaries, and more. In the most recent study, ‘2015-2016 Dice Tech Salary Survey’, the Python syntax, and especially R, are favorably placed in the rating of professional salaries: 126,249 dollars a year for professionals with knowledge of R, and 109,782 dollars for Python.
There are also several packages available for making data representations in Python: matplotlib is one of the most widely used in data science for all kinds of graphics (bar charts, scatter charts, fever charts, and maps with Basemap and in 3D with mplot3D…) with very little code; and Seaborn, another library in Python based on matplotlib that offers scientists a package that enables them to create explanatory graphs from highly complex data. Python plugins are also gradually catching up with the resources available in a data visualizer when it uses R.
Python and R also have their drawbacks
● R is a slow programming language: this tends to be one of the recurrent complaints mentioned by developers when asked about the drawbacks of programming with R. There’s always someone who says the syntax is slow. Although this is widely acknowledged by almost everyone, it’s also true that some programmers explain this lack of speed by the fact that many of the packages used to add features are not developed in R, but in other syntaxes such as Fortran and C++. And this takes its toll.
There is also a general consensus that Python is faster, particularly because this language has more resources to make it so.
R is an erratic tool for machine learning projects; some developers prefer Python, and particularly its scikit-learn library, a simple and effective tool for data mining and information analysis which allows the simple re-use of code between projects, and has all the benefits of being an open-code library (BSD license).
● Python doesn’t have good documentation: some programmers complain about the lack of good documentation for Python, particularly compared to other programming languages like PHP and Java. It has other drawbacks –this analysis by datafull.co is a good summary.
In the dynamic world of payments, a new star has emerged in recent years: Buy Now Pay Later (BNPL), i.e. short-term financing that allows you to buy now and pay later. This model allows businesses to purchase goods or services and pay for them in installments, often interest-free, making it an attractive alternative to credit […]
BBVA and Vecttor, Cabify’s subsidiary engaged in managing vehicles with drivers, have entered into an alliance that saves time and provides security to the company and its drivers. The collaboration allows drivers to deposit cash collections at any BBVA ATM and Vecttor to automatically reconcile this activity from their accounts with those in the company’s […]
BBVA has been recognized by Global Finance as the bank with the best global open banking offer for companies. This award comes on top of 12 other recognitions the magazine has bestowed on the company, such as the best bank for corporate clients and the one recognizing its AI factory as one of the best […]
Please, if you can't find it, check your spam folder
×
The email message with your ebook is on the way
We have sent you two messages. One with the requested ebook and one to confirm your email address and start receiving the newsletter and/or other commercial communications from BBVA API_Market
×
PROCESSING OF PERSONAL DATA
Who is the Data Controller of your personal data?
Banco Bilbao Vizcaya Argentaria, S.A. (“BBVA“) with registered address at Plaza de San Nicolás 4, 48005, Bilbao, España and Tax ID number A-48265169 . Email address: contact.bbvaapimarket@bbva.com
What for and why does BBVA use your personal data for?
For those activities among the following for which you give your consent by checking the corresponding box:
to receive newsletter from BBVA API_Market through electronic means;
to send you commercial communications, events and surveys relating to BBVA API_Market to the e-mail address you have provided.
For how long we will keep your data?
We will keep your data until you unsubscribe from receiving our newsletter or, if applicable, the commercial communications, events and surveys to which you have subscribed. Whether you unsubscribe or whether BBVA decides to end the service, your details will be deleted.
How can I unsubscribe to stop receiving newsletters and/or communications from BBVA API_Market?
You can unsubscribe at any time and without need to indicate any justification, by sending an email to the following address: contact.bbvaapimarket@bbva.com
To whom will we communicate your data?
We will not transfer your personal data to third parties, unless it is mandatory by a law or if you have previously agreed to do so.
What are your rights when you provide us with your information?
You will be able to consult your personal data included in BBVA files (access right)
You can modify your personal data when they are inaccurate (correction right)
You may request that your personal data not be processed (opposition right)
You may request your personal data be deleted (suppression right)
You can request a limitation on the processing of your data in the allowed cases (right of limitation of processing)
You will be able to receive, in electronic format, the personal data you have provided to us, as well as to transmit them to another entity (portability right)
You are responsible for the accuracy of the personal data you provide to BBVA and to keep them duly updated. If you believe that we have not processed your personal data in accordance with regulations, you can contact the Data Protection Officer of BBVA at the following address dpogrupobbva@bbva.com.
You can find more information in the “Personal Data Protection Policy” document on this website.
×
PROCESSING OF PERSONAL DATA
Who is the Data Controller of your personal data? Banco Bilbao Vizcaya Argentaria, S.A (“BBVA“), with registered address at Plaza de San Nicolás 4, 48005, Bilbao, España, and Tax ID No. A-48265169. Email address:contact.bbvaapimarket@bbva.com
What for and why does BBVA use your personal data for?
For the execution and management of your request, specifically, download the requested e-book/s.
BBVA informs you that, unless you indicate your opposition by sending an email to the following address: contact.bbvaapimarket@bbva.com, BBVA may send you commercial communications, surveys and events related to products and/or services of BBVA API Market through electronic means.
For how long we will keep your data?
We will keep your data as long as necessary for the management of your request, and to receive commercial communications, events and surveys. BBVA will keep your data until you unsubscribe to stop receiving our newsletters or, where appropriate, until the end of the service. Afterwards, we will destroy your data.
How can I unsubscribe to stop receiving newsletters and/or communications from BBVA API Market?
You can unsubscribe at any time and without need to indicate any justification, by sending an email to the following address: contact.bbvaapimarket@bbva.com
To whom will we communicate your data?
We will not transfer your personal data to third parties, unless it is mandatory by a law or if you have previously agreed to do so.
What are your rights when you provide us with your information?
You will be able to consult your personal data included in BBVA files (access right)
You can modify your personal data when they are inaccurate (correction right)
You may request that your personal data not be processed (opposition right)
You may request your personal data be deleted (suppression right)
You can request a limitation on the processing of your data in the allowed cases (right of limitation of processing)
You will be able to receive, in electronic format, the personal data you have provided to us, as well as to transmit them to another entity (portability right)
You can exercise before BBVA the aforementioned rights through the following address: contact.bbvaapimarket@bbva.com
You are responsible for the accuracy of the personal data you provide to BBVA and to keep them duly updated.
If you believe that we have not processed your personal data in accordance with the regulations, you can contact the Data Protection Officer at the following address: dpogrupobbva@bbva.com
You can find more information in the “Personal Data Protection Policy” document on this website.
Banco Bilbao Vizcaya Argentaria, S.A. owner of this portal uses cookies and/or similar technologies of its own and third parties for the purposes of personalization, analytics, behavioral advertising or advertising related to your preferences based on a profile prepared from your browsing habits (e.g. pages visited). If you wish to obtain more detailed information, consult our Cookies Policy.
Cookie settings panel
These are the advanced settings for first-party and third-party cookies. Here you can change the parameters that will affect your browsing experience on this website.
Technical Cookies (required)
These cookies are used to give you secure access to areas with personal information and to identify you when you log in.
Name
Owner
Duration
Description
gobp.lang
BBVA
1 month
Language preference
aceptarCookies
BBVA
1 year
Configuration Accepted Cookies
_abck
BBVA
1 year
Helps protect against malicious website attacks
bm_sz
BBVA
4 hours
Helps protect against malicious website attacks
ADRUM_BTs
Salesforce Marketing Cloud
Session
Required for monitoring of the service, inherent to SFMC
ADRUM_BT1
Salesforce Marketing Cloud
Session
Required for monitoring of the service, inherent to SFMC
ADRUM_BTa
Salesforce Marketing Cloud
Session
Required for monitoring of the service, inherent to SFMC
ADRUM_BT
Salesforce Marketing Cloud
Session
Required for monitoring of the service, inherent to SFMC
xt_0d95e
Salesforce Marketing Cloud
Session
Remember user preferences (if any)
__s9744cdb192d044faa1bf201d29fafd1e
Salesforce Marketing Cloud
Session
Remember user preferences (if any)
wpml_browser_redirect_test
WPML
Session
Text translation in the portal
wp-wpml_current_language
WPML
24 hours
Text translation in the portal
They are used to track the activity or number of visits anonymously. Thanks to them we can constantly improve your browsing experience
Your browsing experience is constantly improving.
With your selection, we cannot offer you a continuously improved browsing experience.
Name
Owner
Duration
Description
AMCV_***
Adobe Analytics
Session
Unique Visitor IDs used in Cloud Marketing solutions
AMCVS_***
Adobe Analytics
2 years
Unique Visitor IDs used in Cloud Marketing solutions
demdex (safari)
Adobe Analytics
180 days
Create and store unique and persistent identifiers
sessionID
Adobe Analytics
Session
Launch's internal cookie used to identify the user
gpv_URL
Adobe Analytics
Session
Adobe Analytics plugin: getPreviousValue Capture the value of a certain variable in the following page view, in this case the prop1
gpv_level1
Adobe Analytics
Session
Cookie used to store the DataLayer levl1 of the previous page.
gpv_pageIntent
Adobe Analytics
Session
Cookie used to store the pageIntent of the previous page.
gpv_pageName
Adobe Analytics
Session
Cookie used to store the pagename of the previous page.
aocs
Adobe Analytics
Session
Cookie that stores the first values collected at the beginning of a process.
TTC
Adobe Analytics
Session
Cookie used to store the time between the App Page Visit event and the App Completed event.
TTCL
Adobe Analytics
Session
Cookie used to store the time between the LogIn event and App Completed.
s_cc
Adobe Analytics
Session
Determine if cookies are active
s_hc
Adobe Analytics
Session
Cookie used by Adobe for analytical purposes
s_ht
Adobe Analytics
Session
Cookie used by Adobe for analytical purposes
s_nr
Adobe Analytics
2 years
Determine the number of user visits
s_ppv
Adobe Analytics
Permanent
Adobe Analytics plugin: getPercentPageViewed Determine what percentage of the page a user views
s_sq
Adobe Analytics
Session
ClickMap/ActivityMap features
s_tp
Adobe Analytics
Session
Cookie used by Adobe for analytical purposes
s_visit
Adobe Analytics
2 years
Cookie used by Adobe to know when a session has been started.
They allow the advertising shown to you to be customized and relevant to you. Thanks to these cookies, you will not see ads that you are not interested in.
The advertising is customized to you and your preferences.
Your choice means you will not see customized ads, only generic ones.
Name
Owner
Duration
Description
OT2
VersaTag
90 days
VersaTag Cookie used to store a user id and the number of user visits.
u2
VersaTag
90 days
VersaTag Cookie where the user ID is stored
TargetingInfo 2
MediaMind
1 year
Cookie that serves to assign a unique random number that generates MediaMind.
These cookies are related to general features such as the browser you use.
Your experience and content have been customized.
With your selection, we cannot offer you a continuously improved browsing experience.
Name
Owner
Duration
Description
mbox
Adobe Target
9 days
Cookie used by Adobe Target to test user experience customization.
×
Looks like you’re browsing from MexicoSpainArgentinaPeruColombiaBelgiumChileUSAFranceHong KongItalyPortugalUnited KingdomTurkeyUruguayVenezuelaAlemania, so let’s show you the custom content for your
location. Change
Select a country
In order to access the private area and corresponding sandbox, select the country of the APIs you want to use.