API World

News and case studies on embedded finance, APIs and much more

4 min reading

| 02 NOVEMBER 2016

React and D3, the perfect mix for visualizing complex data

This is the best time in history for dynamic data visualization. The typical dashboard tools available for use as graphics creation programs include Tableau and Qlik, in addition to numerous JavaScript libraries for creating simple visualizations with complex datasets. Today, the perfect combination for this type of analytical productivity is a mixture of the JavaScript libraries D3 and React. D3 is a great option, but React has the potential to multiply its possibilities.

We’ve already discussed D3, but we’ve said less about React, although we also dedicated one article to its features. React is an open code JavaScript library developed by Facebook. These two elements –open code and Facebook– already have enough clout to attract the attention of any front-end developer. But the goal driving its development makes it even more appealing: to create dynamic components that can be reused in different user interfaces. What’s more, it’s a library for development from both the client and server sides. It’s a full-stack library in JavaScript.No hay nada más que darse una breve vuelta por Google Trends para darse cuenta de la explosión en el interés en React. Búsquedas como ‘React’, ‘Reactjs’, ‘React Native’ o ‘Facebook React’ ha explotado literalmente en el gran buscador durante el último año. Ver la curva de crecimiento muestra la atención que ha acaparado:

You only need to take a brief tour of Google Trends to get an idea of the booming interest in React. Searches such as “React”, “Reactjs”, “React Native” and “Facebook React” have mushroomed spectacularly on the giant search engine in the last year. A look at the growth curve reveals the attention it has attracted:

Why incorporate React into D3

Why does it make sense to incorporate a plugin with React into the visualization works in D3? When a front-end developer creates dynamic graphics in which no kind of subsequent maintenance, purging or scaling will be required, in all likelihood D3 will be more than enough for that finite work. But when these data visualizations are part of a series that will undergo subsequent changes, incorporating React may bring a number of advantages:

  • Component-based work: We’ve already said that the main aim of React is to create front-end components that can be reused in different user interfaces. In the work of data visualization, the subdivision into components makes it much simpler to subsequently test and purge each of the components in the dynamic visualization. What’s more, once they’ve been tested and purged, these components can be moved without risk of error.What’s really interesting about React is that because of JSX, an extension of the JavaScript syntax created by Facebook, JS becomes a very similar language to XML or HTML. Thanks to this advance from React, the components of the different visualizations can be used in any user interface as elements that are inserted as HTML tags: for example, a histogram (<Histogram />) or a pie chart (<Piechart />). This allows the code used in the data visualizations to be declarative, reusable, understandable and organized. This article from Sitepoint perfectly explains these four elements of the React code:
    render() {
    
    	  // ...
    
    	  return (
    
    	      <g transform={translate}>
    
    	          <Histogram data={this.props.data}
    
    	                     value={(d) => d.base_salary}
    
    	                     x={0}
    
    	                     y={0}
    
    	                     width={400}
    
    	                     height={200}
    
    	                     title="All" />
    
    	          <Histogram data={engineerData}
    
    	                     value={(d) => d.base_salary}
    
    	                     x={450}
    
    	                     y={0}
    
    	                     width={400}
    
    	                     height={200}
    
    	                     title="Engineer" />
    
    	          <Histogram data={programmerData}
    
    	                     value={(d) => d.base_salary}
    
    	                     x={0}
    
    	                     y={220}
    
    	                     width={400}
    
    	                     height={200}
    
    	                     title="Programmer"/>
    
    	          <Histogram data={developerData}
    
    	                     value={(d) => d.base_salary}
    
    	                     x={450}
    
    	                     y={220}
    
    	                     width={400}
    
    	                     height={200}
    
    	                     title="Developer" />
    
    	      </g>
    
    	  )
    
    	}

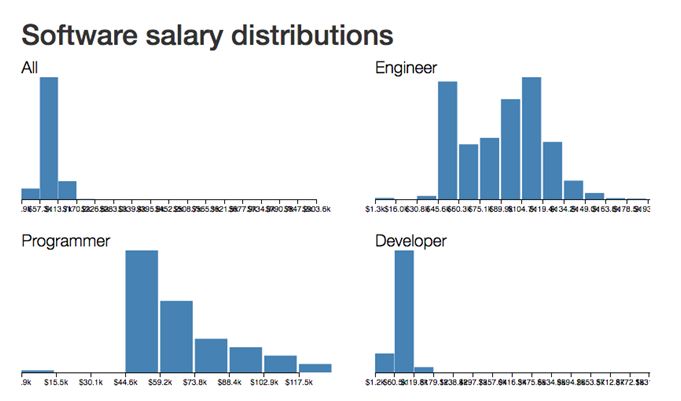
    Here you can see the rendering of four histograms with the title, their width and height values, the coordinates (x and y) and the data source for the actual visualization. With the final resulting graphic:

    • React modifies only the display of components that have changes in their data: this is possibly the greatest advantage for front-end developers working with data visualization, particularly if they’re handling large volumes of information. One of the main features of React is that it allows the whole DOM to be searched for any elements or components that have undergone changes in their data, so the updated display can be redrawn. This can be done thanks to what are known as difference algorithms, which search the whole node tree in the DOM for any that have undergone new changes, and provide an updated display with the new data in the virtual DOM.This process of identifying and loading differences in data in the displays is what allows React to bring greater added value to complex and bulky information visualization libraries such as D3. If we’re making a dynamic graphic with thousands of data with D3, every change in any of the figures in a JSON requires the whole page to be updated, involving loading the whole set of data, analyzing them, redrawing them… With React this is never necessary, because it only updates the display in these changes through what in this library is known as “hot reloading”.Are you interested in financial APIs? Discover all the options offered by BBVA