Illustreets is a web tool for users who want to rent or buy a flat in England. It helps them to find the best neighborhood. This application gathers open data from different government sources, and offers an appealing and intuitive interface.
This article contains a simple analysis of the data and interaction model required to develop an application such as Illustreets. We will use CartoDB as a tool for storing and analyzing information. Specifically, we will use:
· CartoDB’s API SQL
· CartoDB’s javascript API, CartoDB.js
Additionally, we will see how information from BBVA Data API could enrich this application even further.
Introduction. What is this tool like?
The map’s colors are what you first notice when you see this application: polygons representing specific neighborhoods range from green to red depending on their standard of living, where green identifies a higher standard of living. Even though the interface is very comprehensive, it does not hinder map exploration.
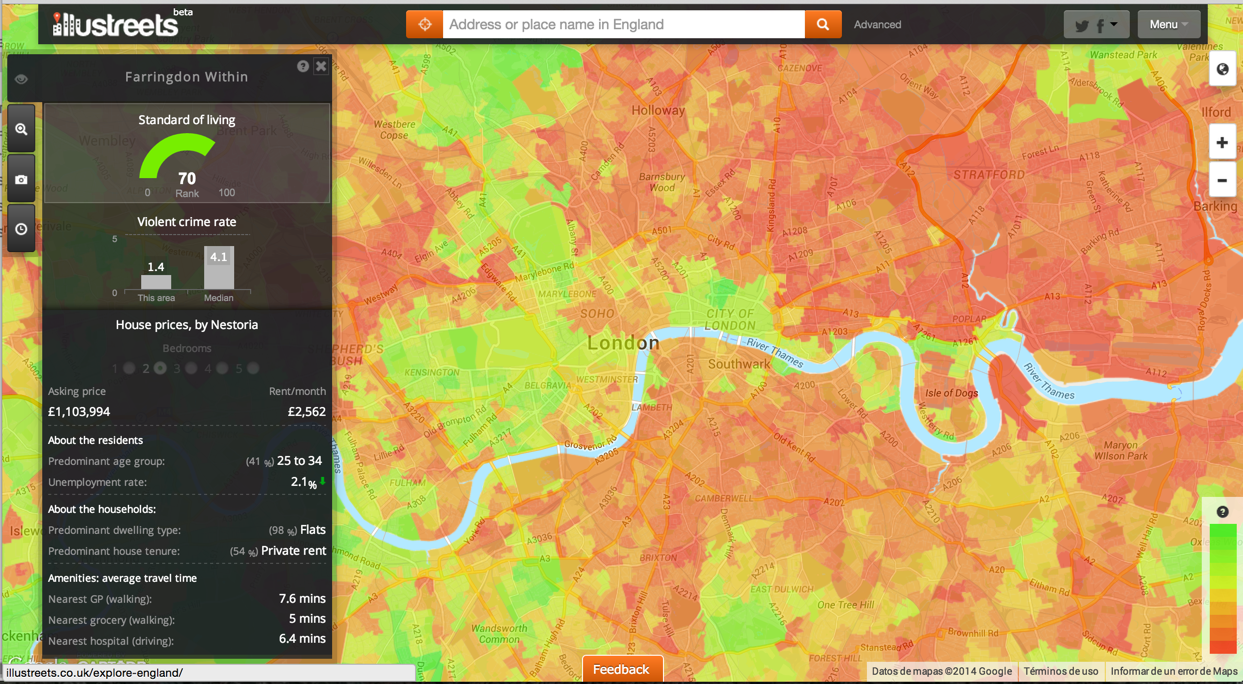
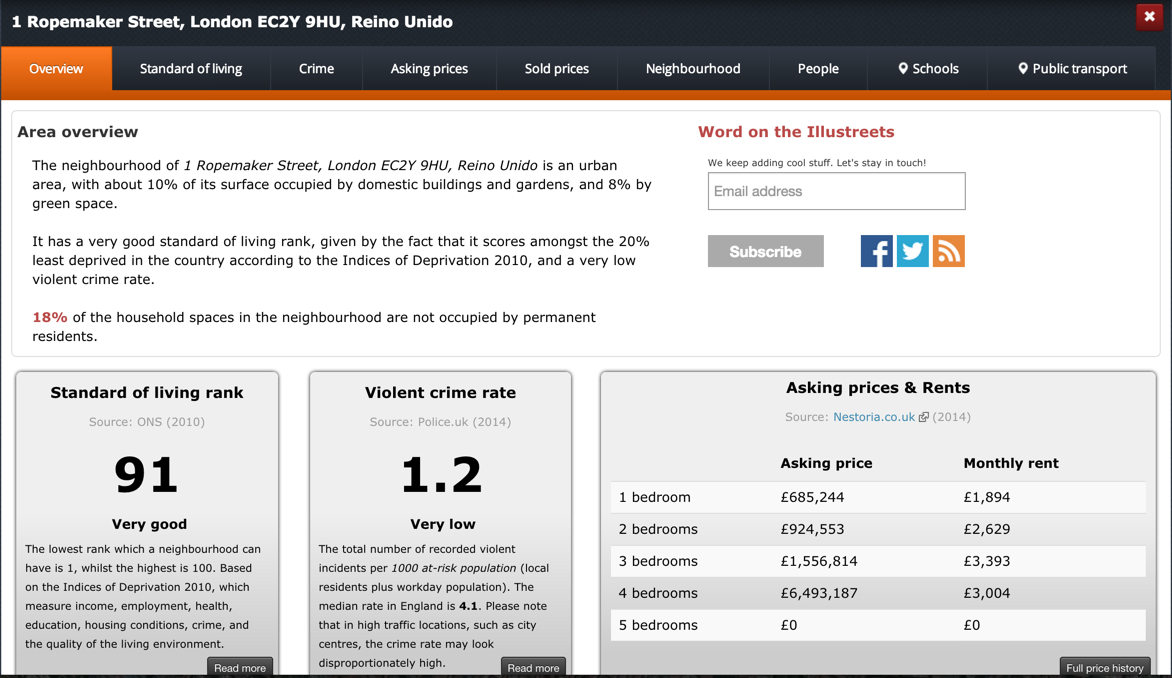
When you hover over any of the polygons, the left-hand side bar automatically shows fairly comprehensive statistics about the standard of living, violent crime rate, etc. If you click on any of the polygons, a report with interesting and useful information for potential residents is shown at the bottom of the screen.
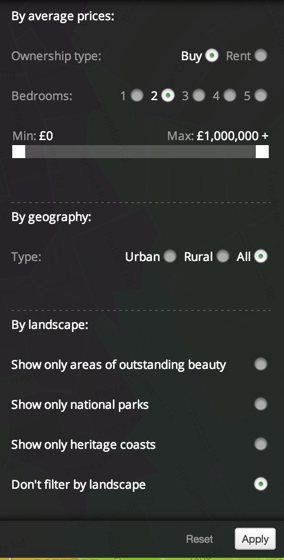
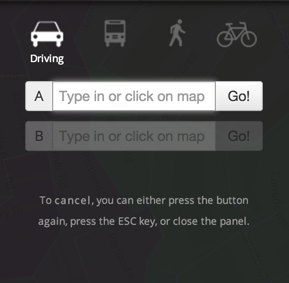
But the left-hand side bar goes beyond statistics. You can also filter by price and estimated travel time.
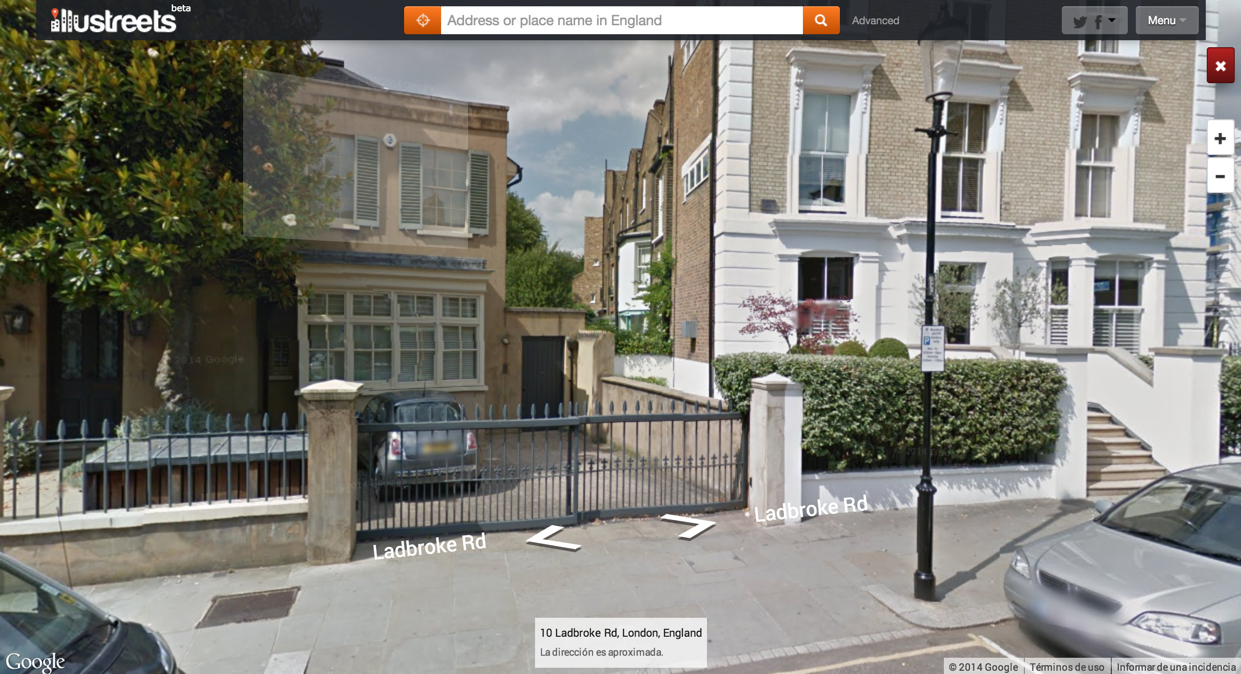
Lastly, the tool is connected to Google Street View: we can go for a “virtual tour” of the area and see what is really looks like.
Components: polygon properties
CartoDB.js makes it very easy to show information when you hover over a polygon. You can see a simple example here.
This basic interaction suggests that our data model could be based on a table with polygons. Next to each polygon, there could be a series of statistics. These could be better understood by showing reports when you click on any polygon; however, this is not necessary in our example:
· Standard of living (integer value between 0 and 100)
· Crime rate (integer value between 0 and 15)
· Unemployment rate (percentage)
CartoDB also makes it very simple to create a table consisting of these fields (see our article on archeological routes in Córdoba).
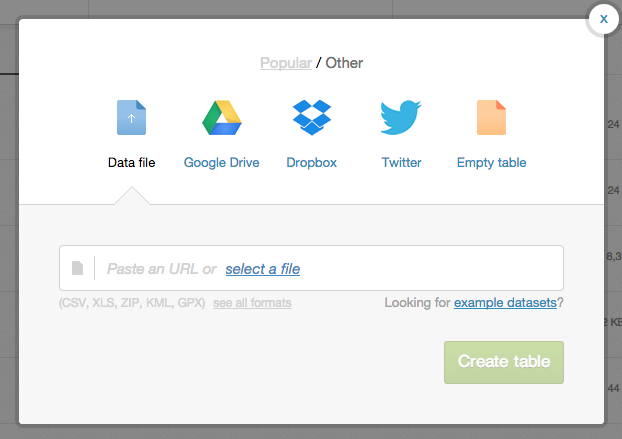
First, we will log into our CartoDB account (click here to get a free CartoDB account), go to the dashboard, and add a new table, using the create table button that looks like this:

We are shown different options. Choose Empty table
An unnamed table is created, which we will later rename. In this case, we will call it polygon_table.

Later, we can add any required fields by clicking the Add column icon (bottom right).

The field type will be number, and the fields will be called standard_of_living, crime_rate and unemployment_rate.
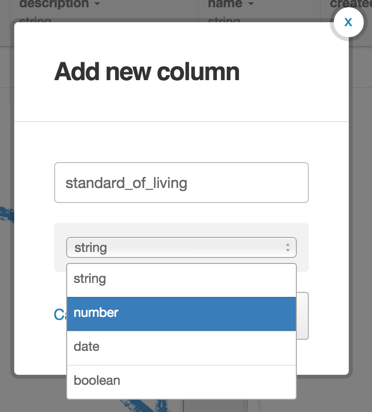
The geometric field where the polygon will be stored is created automatically, under the name the_geom.
There are several options for capturing other statistics and linking them with our polygons. To choose, we should ask ourselves:
Is the data model going to be expanded regularly to include more age groups, types of property, etc.?
If the answer is YES, it is be better to create additional tables for each statistic, and link these tables with the polygon table. We can, for example, create a table called RENTAL_PRICE with the following fields:
· polygon_id: stores the cartodb_id field from the polygon table. The tables will be linked.
· num_rooms: integer between 1 and N
· rental_price
· sale_price
Once this is completed, we will know the average rental and sale price of a property with a specific number of rooms in each of the polygons. If we add rental/sales prices for properties with any number of rooms (6, 7, 8, etc.), the data model will not have to be changed. We will only have to add rows to this table.
Naturally, creating this table with CartoDB is as simple as in the previous example.
If the answer is NO, we can expand our polygon table to include extra columns with the following requirements for each neighborhood:
· Average rental/sale price for one to five-room houses.
· Predominant age range (19-25, 26-34, etc.)
Depending on the available space, we can choose to create a column for each new type of data:
· Rental price, 1-room flat
· Sale price, 1-room flat
· Rental price, 2-room flat
· Sale price, 2-room flat
· Percentage of neighbors aged 19-25 years
· Percentage of neighbors aged 26-34 years
· Etc.
Another option would be to use the hstore warehouse by PostgreSQL; however, this process would be much more complex, and we will not look into it in this article.
We must not forget the pros and cons of our two options for creating a polygon-based data model.
If we create an extra table to capture polygon-associated statistics:
· If we expand the range of our statistics (e.g. including prices of flats with more than five rooms, adding age ranges, etc.), the data model does not need to be changed. We only have to add rows to some tables.
· Searches for statistics will involve cross-referencing the polygon table with the statistics tables. If the tables are too big, this search can be slow.
If we add an extra column to the polygon table for each statistic:
· If we expand the range of statistics, the data model will have to be changed (adding and populating new columns in the polygon table).
· Searches for statistics will only use one table with no need for cross-referencing.
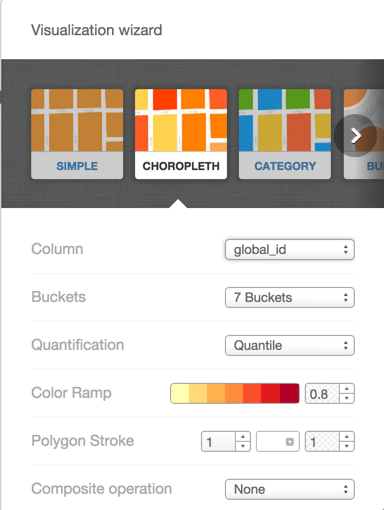
Once the polygon table (and any additional tables, if applicable) is created, we can use the editor’s Wizard to create a color-based view similar to the one on Illustreets. We will choose choropleth visualization, and apply color to the standard of living column.
To finish this analysis of the data model, we would like to mention another very useful, automatic and simple feature: calculating distances to points of interest. This is possible thanks to CartoDB’s full support of PostGIS. This is the subject of our next section.
Components: route engine
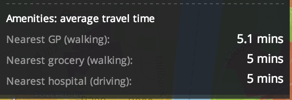
When we hover over a polygon, the statistics include this:
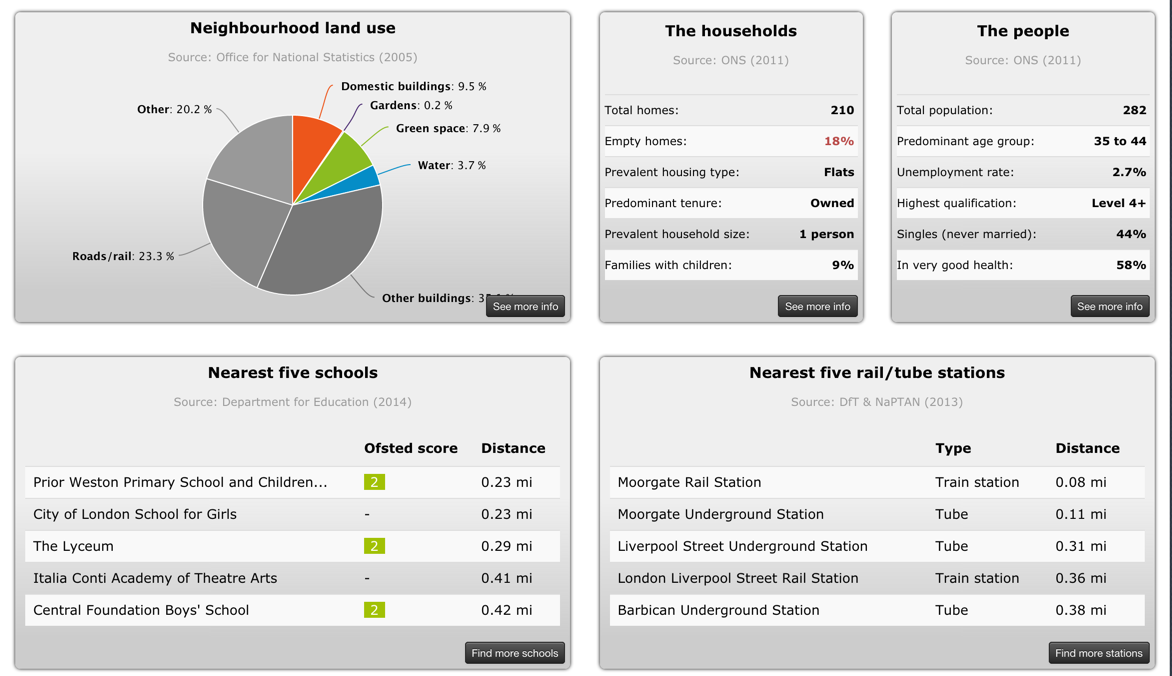
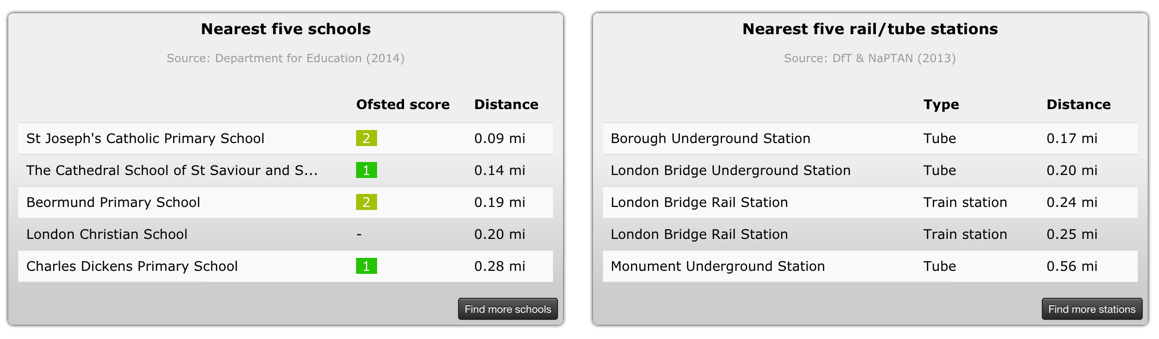
If we click on any of the polygons, we can see this at the bottom of the screen:
This feature requires that our application has an additional table with POIs (points of interest). Or that this information is retrieved in real time from external sources, such as Foursquare’s API (see article about archeological routes in Córdoba).
If there is a table with points of interest, we can easily find out the distance to the desired polygons by using SQL language. This operation can be performed by the back-end code in our application (the code run in our machines before the answer is sent to the client’s browser). We can also choose from two types of operations:
· Getting distances from our polygons to nearest points of interest. The result will be a numerical value. This is an useful operation if we want to get a table with distances in meters (or miles), as was the case with our second search above.
· Get only the nearest points of interest, in order of distance. This is an useful feature if we do not want to know the numerical distance value but rather the location of our points of interest so that we can calculate travel times.
For the first case, the SQL query will be as follows:
SELECT st_distance(pol.the_geom_webmercator, poi.the_geom_webmercator) as dist from tabla_poligonos pol, tabla_pois poi where pol.cartodb_id = 1 AND poi.type = ‘Hospital’ ORDER BY dist ASC
The result will be a list of points of interest (hospitals in this case), in order of distance to a specific polygon (id = 1, for instance). An HTML table will be built from this information.
Please note the “hidden trick” in this query: we are using the_geom_webmercator as a field in st_distance from PostGIS. If we check our polygon table in CartoDB’s editor, this field will not be included. This field is created internally to facilitate visualization. In our example, this is very useful – it stores geometries in a format that allows distances to be measured in meters rather than degrees. For more information on this subject, please click here
If we want a list of POIs in order of distance to our polygon, we can run this query:
select poi.the_geom, poi.name from pois poi, tabla_poligonos pol where poi.pol_id = pol.cartodb_id AND pol.cartodb_id = 17 ORDER BY poi.the_geom <-> pol.the_geom
The direct result would be a list of points of interest, in order of distance to a specific polygon (id = 17). We could use the names and geometries of polygons as input arguments for a route calculation engine that would show estimated travel times between the center of our polygon and the returned POIs. This would allow us to create the side bar feature. The route calculation feature could be implemented with the extension pg_routing from PostGIS. Since this is not activated by default on CartoDB, we would have to use the support equipment to query it.
We should note that PostGIS “distance” operator is used: <->. This was included in PostGIS version 2.0, thanks to CartoDB’s funding. For more information, please click here.
But, what would happen if we did not have the POI table?
In this case, we would have to retrieve the points of interest in real time instead of obtaining them from a table. We could use SQL language. Distance and travel time calculation would have to be performed by other means.
One option would be to use the OSRM API. Or we could delegate this feature to the client’s browser: the web application would perform the calculation. We could use Google Directions API.
Components: filtering locations by price
Illustreets also offers the option to filter properties by price. To access this filter, we need to click on the advanced search icon on the left-hand side bar (second from the top).

This type of filter is very simple to operate. It would only involve launching an SQL query parameterized with the selected minimum and maximum values. Something like this:
SELECT * FROM tabla_poligonos WHERE avg_price >= min AND avg_price <= max;
The view would be updated to show us only the polygons that matched this restriction.
Added Value: BBVA Data API
Using BBVA Data API in this type of application would be particularly interesting. There are many possible options, such as:
· Add categories with the highest payment to each polygon. Potential residents would be able to find out whether they were looking at a commercial neighborhood and, if so, what type of neighborhood (fashion, food, leisure, etc.). We could use the results returned by this request.
· Add the average expenditure by category to each age range in the polygon. We would be able to find out whether residents within a specific age range preferred expenses in a certain category. This would be useful if we wanted to add rental/sale prices of commercial premises, for instance. We could use the results returned by this request
· Create a consumption pattern model for each polygon. We could find out when certain types of shopping should be made. We could use the results returned by this request.
All other requests offered by BBVA API can be found here
In short, we have seen how open data sources, in conjunction with CartoDB‘s storage and analysis features, can result in products that add great value to tasks such as looking for a flat. Also, BBVA Data API could be very useful if we wanted to add commercial and payment information to this type of product. These three powerful tools offer us almost limitless possibilities.