In this post, we will learn how to get information from a REST API, serving JSON data, and store it in CartoDB, so, you can use it later to create data visualizations quick and easily. Specifically, we will gather information from BBVA Data API, which was put online for the InnovaChallengeMX hackathon
We’ll use Python, a really easy-to-use language, with a lot of interesting features for data manipulation, like the built-in json module or the requests library, to handle HTTP requests.
There are probably some coding decisions that are not optimal if you wanted to create solid, testable code, to officially release it, but it just works for our quick test.
So, we will need:
· A free CartoDB account. You can get it here. You will need your API key, to make SQL calls. To read it, just go to https://YOURUSER.cartodb.com/your_apps, after signing up
· A free BBVA developer account. After that, check this link to know how to generate an authentication string you’ll use to make the calls
· A text file with several lines, following the key=value format, containing the parameters for BBVA API call. This is just one way to pass the information to the script. The file will look like this
· The Python interpreter. You can download it from here
· The requests Python library, to make HTTP requests. Instruction to install this library are here. And if you’re a Debian / Ubuntu user, it’s as easy as
sudo apt-get install python-requests
That’s all. Now, time to start
For our test, we will use the BBVA data API, that BBVA provides for InnovaChallengeMX. The process has 4 general steps:
1. Decide a data model that works for us, and translate it to CartoDB, in form of PostgreSQL table, or tables.
2. Make requests to the source API, and get the JSON response
3. For each requests, transform the response JSON object into a SQL sentence, to insert data in our data model
4. Raise a query using CartoDB SQL API, and the INSERT query built in the previous step.
Reading the BBVA data API, we found an interesting request. It provides statistics of credit card payments for a tile (a 550x500m area) and particular commercial category, differentiated by gender and age segments. Pretty complete. We’ll work with it, but flattening the JSON `response a bit, to fit in this schema:
stats_table(the_geom, the_date, age, gender, num_cards, num_payments, avg)
The meaning of the fields is:
· the_geom: point representing the center of a 550x500m tile
· the_date: date to check
· age: age range for payers
· gender: gender of payers
· num_cards: number of different credit cards that were used in that date in places inside that tile
· num_payments: number of payments made in that date in places inside that tile
· avg: average value of payments made in that date in places inside that tile
To fill this table, we’ll need a list of (X,Y) points to call BBVA API, in order to have some data to show. We can get a list of the most popular points from BBVA API, using this query.
Now, we’re ready to create an empty table in CartoDB, rename it to stats_table, create the columns we’ll need, and fill it with data. How?
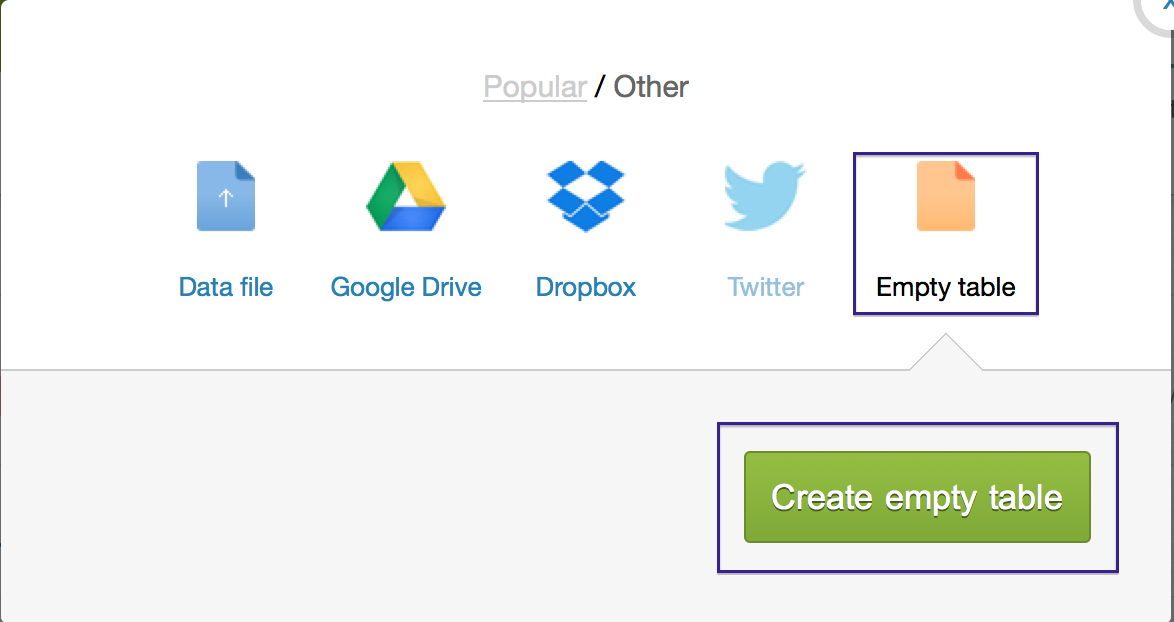
First, click on the New table icon, on the right side

Pick the Empty table option
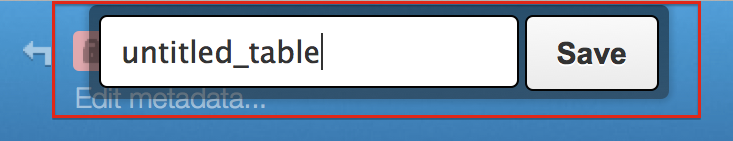
A table named untitled_table will be created, and you will be headed to table view. Just double-click on the table name, and change it. We’ll name it stats_table
Let’s have a look at our new table. It already contains a few columns:
· cartodb_id: a serial. Automatically filled with each insertion
· the_geom: Our geometry (it will be a point, in our example)
· description: we won’t use it
· name: we won’t use it
· created_at: Timestamp. Automatically takes the current moment as value
· updated_at: Timestamp. Automatically takes the current moment as value when the row is modified
We still need more fields: the_date, age, gender, num_cards, num_payments, avg. So, we add them using the Add column button, on the lower right.

About the data type, we’ll use date for the_date, string for age and gender, and number for num_cards, num_payments and avg.
Now we have our API request, and our tables created, we can write our translator, from BBVA JSON API to CartoDB. Our Python script, will look like this.
First, the imports
#!/usr/bin/python
# -*- coding: utf-8 -*-
import sys, requests
from os import environ
As said, we imported requests library. It includes the ability to handle json data, so, no need to include json module.
Now, we define all url calls we will use:
bbva_url_most_popular_tiles = "https://apis.bbvabancomer.com/datathon/info/tiles"
bbva_url_stats = "https://apis.bbvabancomer.com/datathon/tiles/%s/%s/cards_cube"
cartodb_url_sql = "http://%s.cartodb.com/api/v2/sql"
%s elements will be replaced by key values, like user names, or specific locations.
Now, some useful functions
# Just read an environment variable, and raise an error if it isn’t found
def get_env_variable(var_name):
try:
return environ[var_name]
except KeyError:
msg = "Set the %s environment variable"
error_msg = msg % var_name
raise Exception(error_msg)
# Read our secret params from environment variables. You could also provide them
# as input parameters...
def read_secret_params():
cdb_user = get_env_variable('cdb_user')
cdb_apikey = get_env_variable('cdb_apikey')
bbva_auth_str = get_env_variable('bbva_auth_str')
return (cdb_user, cdb_apikey, bbva_auth_str)
# Read the query parameters for BBVA API request
def read_payload_from_file(file_path):
myvars = {}
with open(file_path) as myfile:
for line in myfile:
name, var = line.partition("=")[::2]
if var:
myvars[name.strip()] = var.replace("\n", "")
return myvars
Let’s start with the fun, by reading input secret params, like CartoDB user and API key and BBVA authentication string. We prefer to read these values from environment variables. This way, you won’t need to write them (curious eyes may be watching you). This may not be the best way to handle private keys, but it just works for our purposes.
#TODO: Parse input args
#Read secret params
(cdb_user, cdb_api_key, bbva_auth_str) = read_secret_params()
#We will need this header
headers = {'Authorization' : 'Basic %s' % bbva_auth_str}
#We have all the arguments for the query stored in a text file
bbva_payload = read_payload_from_file(argv[1])
Time to get the points to create BBVA API calls. For that, we will raise a simple SQL query to get all the points from BBVA API
#Now, get the ranking of the most active zip codes (with the greatest number of payments) in descending order
r = requests.get(bbva_url_most_popular_tiles, headers=headers)
data = r.json()
The json() method automatically transforms the raw JSON response in a Python dictionary. Much easier to handle. Now, we’ll fill our own dictionary, using column names as the dictionary keys and values extracted from data as the dictionary values. Then, we’ll use that dictionary to build the INSERT SQL query. Step by step.
First, get the point from CartoDB JSON response, and use it to make a BBVA API call
if 'data' in data and 'coordinates' in data['data']:
for point in data['data']['coordinates']:
longitude = point[0]
latitude = point[1]
r2 = requests.get(bbva_url_stats % (latitude, longitude), params=bbva_payload, headers=headers)
#Get the response in a dict
data2 = r2.json()
Second, parse the metadata from this response. It’s basically an index, containing all the groups of age ranges and genders.
if 'metadata' in data2 and 'hash_description' in data2['metadata'] and 'ranges' in data2['metadata']['hash_description'] and 'data' in data2 and 'stats' in data2['data']:
# Parse metadata
genders = {}
ages = {}
for range in data2['metadata']['hash_description']['ranges']:
if 'name' in range and 'values' in range:
if range['name'] == 'gender':
for gender in range['values']:
if 'label' in gender and 'description' in gender:
genders[str(gender['label'])] = str(gender['description'])
elif range['name'] == 'age':
for age in range['values']:
if 'label' in age and 'description' in age:
ages[str(age['label'])] = str(age['description'])
Once the metadata has been parsed, we’ll parse the data. We will use the index built in the previous step to get the age range and gender from it.
#Now, parses data
for stat in data2['data']['stats']:
insert_dict = {}
if 'date' in stat:
insert_dict['the_date'] = "'" + str(stat['date']) + "'"
if 'cube' in stat:
cubes = stat['cube']
# Here, we've flatenning the structure, to fin into our data model
for cube in cubes:
if 'hash' in cube:
l = str(cube['hash']).split('#')
insert_dict['age'] = "'" + ages[l[1]] + "'"
insert_dict['gender'] = "'" + genders[l[0]] + "'"
if 'num_cards' in cube:
insert_dict['num_cards'] = str(cube['num_cards'])
if 'num_payments' in cube:
insert_dict['num_payments'] = str(cube['num_payments'])
if 'avg' in cube:
insert_dict['avg'] = str(cube['avg'])
insert_dict['the_geom'] = "ST_SetSRID(ST_MakePoint(%d, %d), 4326)" % (longitude,latitude)
sql2 = "insert into stats_by_gender_and_age(%s) values(%s)" % (','.join(insert_dict.keys()),','.join(insert_dict.values()))
print sql2
#Insert entry in CartoDB
payload2 = {'q': sql2, 'api_key': cdb_api_key}
r3 = requests.get(cartodb_url_sql % cdb_user, params=payload2)
Ok. We’re done. Just need to add the call to main() method.
if __name__ == '__main__':
try:
main(sys.argv)
except Exception, e:
print e
sys.exit(1)
And that’s it! We can call the script this way (assuming we’ve named it bbva2cartodb.py)
python bbva2cartodb.py params.txt
Remember that params.txt is the file with the parameters to the BBVA API query.
Here, you can find the source code of this script (Of course, you can clone the repo, if preferred)
At the end, we will have a CartoDB table containing useful statistics. We’re ready to make visualizations with it. That will be covered in another post but, of course, you’re ready to play with it, using the wizard from the map view. As hint, torque visualization looks promising…
Be ready for more posts!
Find out more about BBVA’s APIs here.