The field of Business Intelligence (BI) is growing at enormous speed. The world of analytics and data reports based on simulation models, optimization and prediction has been undergoing a massive transformation in the last years. The market of advanced analysis and predictive software is expected to increase from 2.17 billion dollars in 2013 to 3.5 billion in 2018. In general, the BI and analytics tools market players are fighting for a cake worth around 21.5 billion dollars in three years, with an annual growth above 9%. Therefore, there are intense movements in this sector.
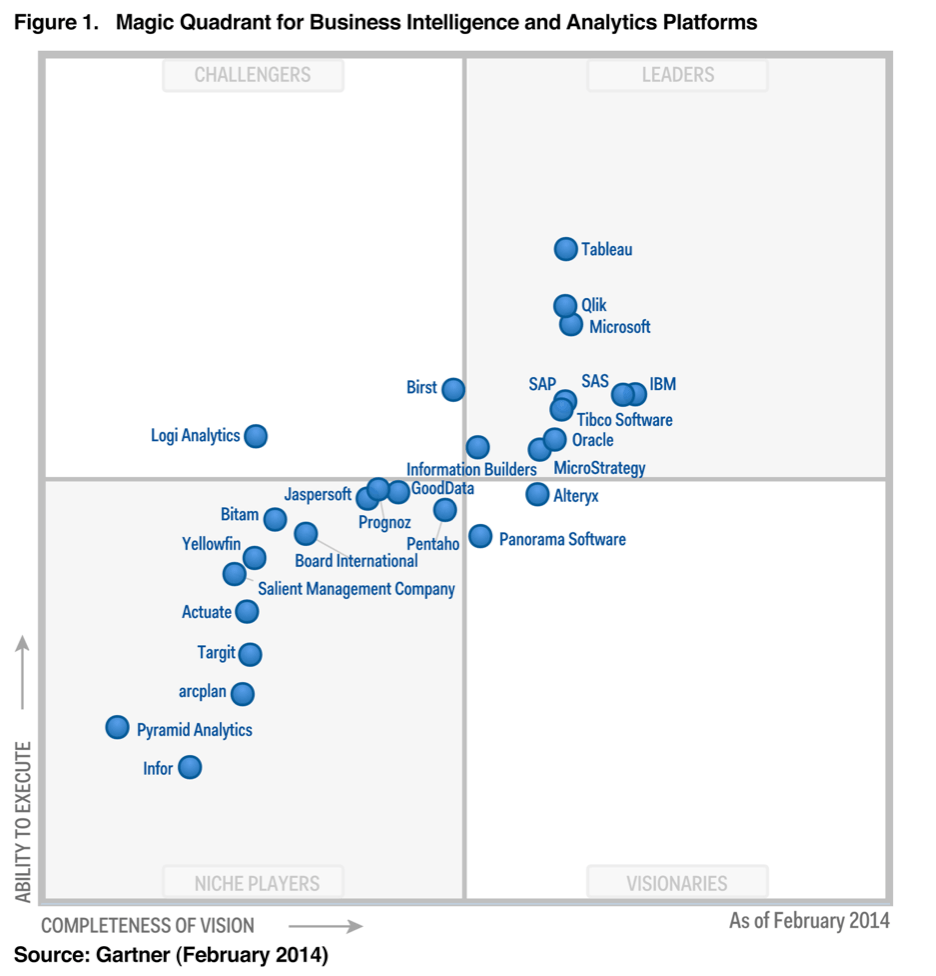
Within this complex market, the five traditional leaders are SAP, Oracle, IBM, SAS and Microsoft. Almost 70% of the sector was distributed among them in 2013. But what seemed a cast-iron truth two years ago has undergone some changes. The emergence of Tableau Software has meant a significant novelty for the BI business, mainly because it allows to manage and analyze data without high technical skills. A self-service Business Intelligence. In fact, Gartner consulting already ranked it as a leading company in 2014. See the table below:
During the third quarter of 2014 Tableau registered the best results in its history, with revenue of 104 million dollars, 71% more than over the previous year. Three months earlier, it had reached 90 million. In 2013, the company’s annual income reached 233 million dollars, 82% more than in 2012. Now, giants like Microsoft are taking steps to reduce the muscle of Tableau and capture some of the benefits of this self-service BI.
Why is Tableau so good?
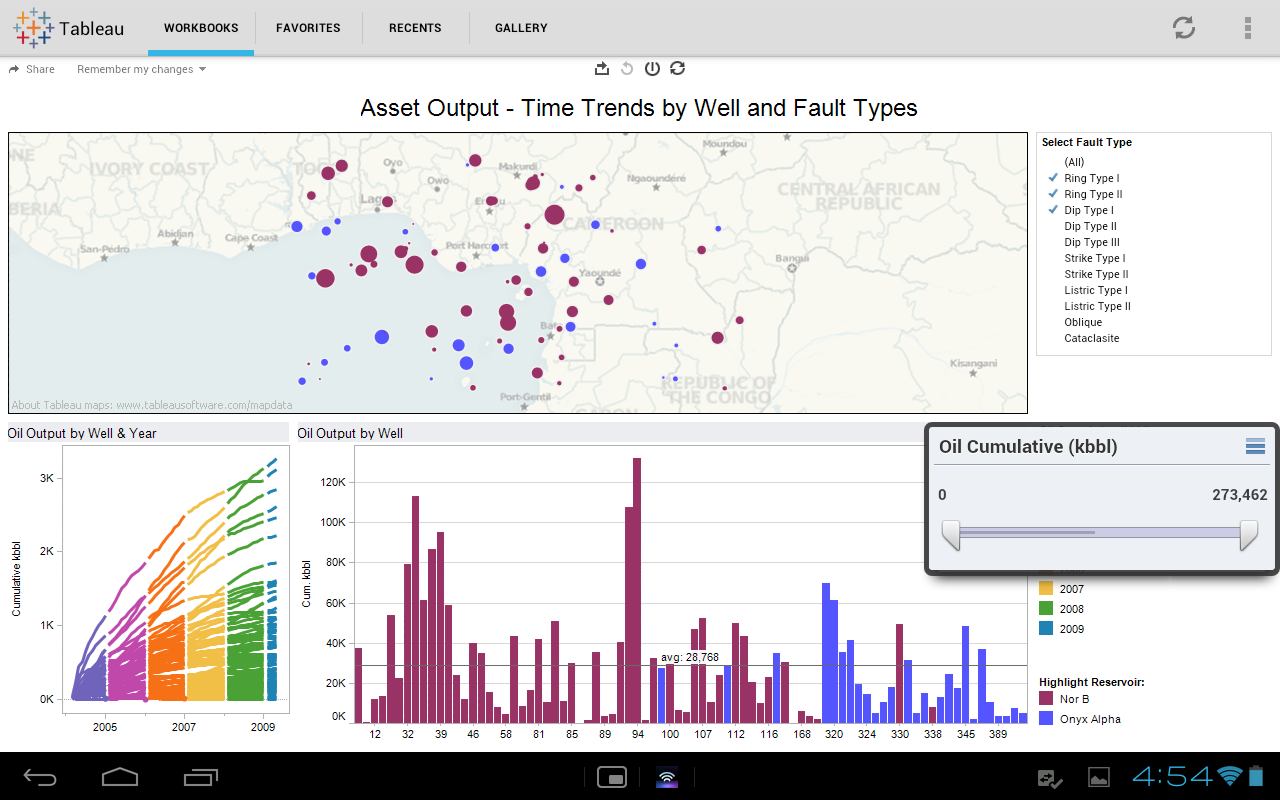
Tableau is a tool for interactive data visualization, i.e. the user can interact with data to compare, filter, connect variables, etc. In addition, the platform and panels that can be created with the tool are very visual (facilitating the rapid understanding of data). It also has some interesting advantages for when you manage databases: it accepts formats with Excel, Access and text; you can access many common databases such as Microsoft SQL Server, MySQL, Oracle or Greenplum, and you also have the possibility of using the Tableau API for systematic data mining.
When Tableau is used by a large company, one of the vital issues is whether it is a scalable tool. And Tableau is scalable, both in hardware and memory. Another essential element for a company that needs a platform for self-service Business Intelligence is safety: Tableau Server provides security permissions at any level the user needs. You can set individual permissions for projects, panels and even users (many times there is confidential information restricted to certain levels of a company).
Microsoft opens its PowerBI tool to compete
The Redmond-based company has been making movements for some time now aiming to gain share in the Big Data market. The last two are the acquisition of Revolution Analytics, a provider of software and services related to R (a programming language commonly used in Data Science and machine learning for statistical calculations and predictive models), and the opening of its PowerBI tool through a freemium model. Users can access now to the professional level of the platform for just 9.99 dollars a month, which means a 75% price reduction. The subscription allows access to PowerBI without an Office 365 license. The trial version is free.
The tool has similar objectives to those of Tableau: enable executives of large companies to do reports and analysis in a simple way. The opening of PowerBI aims to win significant market share from Tableau, but with an added quality: it displays data in charts, but it also processes requests in natural language. Hence, users can ask the platform and it responds to requests with graphics. It’s a mixture of analysis and data visualization with Artificial Intelligence.
This is an important step in the world of Business Intelligence in the race to facilitate the use of data. Microsoft fights to win part of Tableau’s market share, and especially those users who believe that preparing reports with graphs is still overly complex. With PowerBI this situation is less likely, because the platform can produce reports on-demand.
Does Microsoft want to stay there? No; the intention of the technology giant is to increase its revenue via self-service BI, but also to provide access to a tool that can connect to database management systems like Hadoop and SQL Server. It also aims to provide a platform for developers interested in machine learning, implementing in PowerBI functionalities of Azure Machine Learning, Microsoft’s machine learning platform. The ultimate goal is to turn PowerBI into a platform for “predicting future activities such as trends, behaviors and patterns.”
Watson IBM, a more advanced tool
IBM Watson Analytics is a product of the company’s research in Artificial Intelligence. The Watson supercomputer, known for its participation in Jeopardy (the American program of questions and answers), is part of the origin of the current IBM platform for Business Intelligence and predictive modeling. Watson’s functionalities such as natural language recognition are implemented in Watson Analytics, greatly facilitating reporting by companies.
It also has some added features that make Watson Analytics a unique tool, possibly the best BI solution in the market: it features an automatic system that suggests corrections when loading the data (for example it warns about possible duplicate records), it locates trends, and also suggests the most appropriate data visualizations. IBM's idea is that, over time, Watson Analytics will be able to learn from the data that the company is adding to the platform. Pure Artificial intelligence applied to BI.
The tool is available through a freemium system since November 2014. Users can access a trial version before opting for the paid version. In that beta, the future clients of Watson Analytics can run tests with CSV files with less than 100,000 rows, 50 columns and 10MB of weight. They also have 500MB of storage capacity.
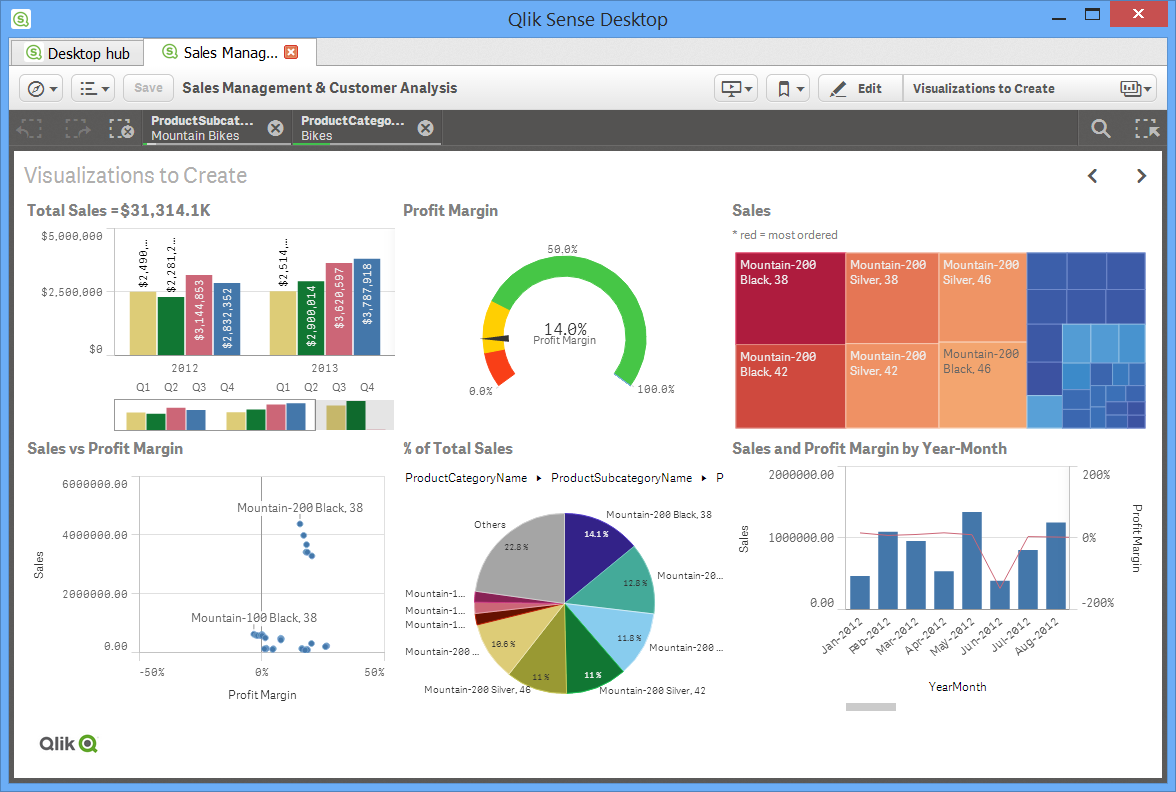
Qlik Sense, Tableau’s alter ego
Qlik Sense is often compared with Tableau. There are many open debates within the community related to data visualization tools about which one is easier or more effective for certain activities. An example of these comparisons is this video on YouTube about the time needed to make a scatter plot in Qlik and Tableau (its author is Craig Bloodworth, who is closely connected to Tableau’s community):
Gartner also placed QlikTech among the leading companies in the field of BI in its quadrant for 2014, close to Tableau both in data visualization and in reporting capacity. The company earned 131 million dollars during the third quarter of 2014, 26% more than in 2013. These figures are higher than those reported by Tableau, although it must be noted that the latter is a popular platform and has become a strong contender in the market.
The reality is that there is a great board game within the Big Data, which is self-service Business Intelligence, and outsiders such as Tableau and Qlik Sense have taken over territory that was formerly controlled by other companies like Microsoft. After the arrival of Satya Nadella as CEO, the Redmond-based company is taking a very determined approach to the data world. The question is… will Microsoft be able to cut off the wings of Tableau?
An API is a very useful mechanism that connects two pieces of software equipment to exchange messages or data in a standard format such as XML or JSON. Thus, it becomes an instrument that can be used to search for revenue, open the doors to talent or innovate and automate processes.
APIs can be a great support when automating business processes Companies, often with a focus on SMEs, spend too many man-hours on time-consuming business processes, thereby making mistakes that a machine would never make. How can business process automation (BPA) help these companies? Is it possible to make use of APIs for BPA? What is […]
Open finance is expected to be regulated over the next few years, leading to a new open data ecosystem Open finance is making its way into the legal system through the consolidation of several initiatives that will lend it legal protection. Once this is complete, customers will have an open finance framework that protects their data […]
Please, if you can't find it, check your spam folder
×
The email message with your ebook is on the way
We have sent you two messages. One with the requested ebook and one to confirm your email address and start receiving the newsletter and/or other commercial communications from BBVA API_Market
×
PROCESSING OF PERSONAL DATA
Who is the Data Controller of your personal data?
Banco Bilbao Vizcaya Argentaria, S.A. (“BBVA“) with registered address at Plaza de San Nicolás 4, 48005, Bilbao, España and Tax ID number A-48265169 . Email address: contact.bbvaapimarket@bbva.com
What for and why does BBVA use your personal data for?
For those activities among the following for which you give your consent by checking the corresponding box:
to receive newsletter from BBVA API_Market through electronic means;
to send you commercial communications, events and surveys relating to BBVA API_Market to the e-mail address you have provided.
For how long we will keep your data?
We will keep your data until you unsubscribe from receiving our newsletter or, if applicable, the commercial communications, events and surveys to which you have subscribed. Whether you unsubscribe or whether BBVA decides to end the service, your details will be deleted.
How can I unsubscribe to stop receiving newsletters and/or communications from BBVA API_Market?
You can unsubscribe at any time and without need to indicate any justification, by sending an email to the following address: contact.bbvaapimarket@bbva.com
To whom will we communicate your data?
We will not transfer your personal data to third parties, unless it is mandatory by a law or if you have previously agreed to do so.
What are your rights when you provide us with your information?
You will be able to consult your personal data included in BBVA files (access right)
You can modify your personal data when they are inaccurate (correction right)
You may request that your personal data not be processed (opposition right)
You may request your personal data be deleted (suppression right)
You can request a limitation on the processing of your data in the allowed cases (right of limitation of processing)
You will be able to receive, in electronic format, the personal data you have provided to us, as well as to transmit them to another entity (portability right)
You are responsible for the accuracy of the personal data you provide to BBVA and to keep them duly updated. If you believe that we have not processed your personal data in accordance with regulations, you can contact the Data Protection Officer of BBVA at the following address dpogrupobbva@bbva.com.
You can find more information in the “Personal Data Protection Policy” document on this website.
×
PROCESSING OF PERSONAL DATA
Who is the Data Controller of your personal data? Banco Bilbao Vizcaya Argentaria, S.A (“BBVA“), with registered address at Plaza de San Nicolás 4, 48005, Bilbao, España, and Tax ID No. A-48265169. Email address:contact.bbvaapimarket@bbva.com
What for and why does BBVA use your personal data for?
For the execution and management of your request, specifically, download the requested e-book/s.
BBVA informs you that, unless you indicate your opposition by sending an email to the following address: contact.bbvaapimarket@bbva.com, BBVA may send you commercial communications, surveys and events related to products and/or services of BBVA API Market through electronic means.
For how long we will keep your data?
We will keep your data as long as necessary for the management of your request, and to receive commercial communications, events and surveys. BBVA will keep your data until you unsubscribe to stop receiving our newsletters or, where appropriate, until the end of the service. Afterwards, we will destroy your data.
How can I unsubscribe to stop receiving newsletters and/or communications from BBVA API Market?
You can unsubscribe at any time and without need to indicate any justification, by sending an email to the following address: contact.bbvaapimarket@bbva.com
To whom will we communicate your data?
We will not transfer your personal data to third parties, unless it is mandatory by a law or if you have previously agreed to do so.
What are your rights when you provide us with your information?
You will be able to consult your personal data included in BBVA files (access right)
You can modify your personal data when they are inaccurate (correction right)
You may request that your personal data not be processed (opposition right)
You may request your personal data be deleted (suppression right)
You can request a limitation on the processing of your data in the allowed cases (right of limitation of processing)
You will be able to receive, in electronic format, the personal data you have provided to us, as well as to transmit them to another entity (portability right)
You can exercise before BBVA the aforementioned rights through the following address: contact.bbvaapimarket@bbva.com
You are responsible for the accuracy of the personal data you provide to BBVA and to keep them duly updated.
If you believe that we have not processed your personal data in accordance with the regulations, you can contact the Data Protection Officer at the following address: dpogrupobbva@bbva.com
You can find more information in the “Personal Data Protection Policy” document on this website.
Banco Bilbao Vizcaya Argentaria, S.A. owner of this portal uses cookies and/or similar technologies of its own and third parties for the purposes of personalization, analytics, behavioral advertising or advertising related to your preferences based on a profile prepared from your browsing habits (e.g. pages visited). If you wish to obtain more detailed information, consult our Cookies Policy.
Cookie settings panel
These are the advanced settings for first-party and third-party cookies. Here you can change the parameters that will affect your browsing experience on this website.
Technical Cookies (required)
These cookies are used to give you secure access to areas with personal information and to identify you when you log in.
Name
Owner
Duration
Description
gobp.lang
BBVA
1 month
Language preference
aceptarCookies
BBVA
1 year
Configuration Accepted Cookies
_abck
BBVA
1 year
Helps protect against malicious website attacks
bm_sz
BBVA
4 hours
Helps protect against malicious website attacks
ADRUM_BTs
Salesforce Marketing Cloud
Session
Required for monitoring of the service, inherent to SFMC
ADRUM_BT1
Salesforce Marketing Cloud
Session
Required for monitoring of the service, inherent to SFMC
ADRUM_BTa
Salesforce Marketing Cloud
Session
Required for monitoring of the service, inherent to SFMC
ADRUM_BT
Salesforce Marketing Cloud
Session
Required for monitoring of the service, inherent to SFMC
xt_0d95e
Salesforce Marketing Cloud
Session
Remember user preferences (if any)
__s9744cdb192d044faa1bf201d29fafd1e
Salesforce Marketing Cloud
Session
Remember user preferences (if any)
wpml_browser_redirect_test
WPML
Session
Text translation in the portal
wp-wpml_current_language
WPML
24 hours
Text translation in the portal
They are used to track the activity or number of visits anonymously. Thanks to them we can constantly improve your browsing experience
Your browsing experience is constantly improving.
With your selection, we cannot offer you a continuously improved browsing experience.
Name
Owner
Duration
Description
AMCV_***
Adobe Analytics
Session
Unique Visitor IDs used in Cloud Marketing solutions
AMCVS_***
Adobe Analytics
2 years
Unique Visitor IDs used in Cloud Marketing solutions
demdex (safari)
Adobe Analytics
180 days
Create and store unique and persistent identifiers
sessionID
Adobe Analytics
Session
Launch's internal cookie used to identify the user
gpv_URL
Adobe Analytics
Session
Adobe Analytics plugin: getPreviousValue Capture the value of a certain variable in the following page view, in this case the prop1
gpv_level1
Adobe Analytics
Session
Cookie used to store the DataLayer levl1 of the previous page.
gpv_pageIntent
Adobe Analytics
Session
Cookie used to store the pageIntent of the previous page.
gpv_pageName
Adobe Analytics
Session
Cookie used to store the pagename of the previous page.
aocs
Adobe Analytics
Session
Cookie that stores the first values collected at the beginning of a process.
TTC
Adobe Analytics
Session
Cookie used to store the time between the App Page Visit event and the App Completed event.
TTCL
Adobe Analytics
Session
Cookie used to store the time between the LogIn event and App Completed.
s_cc
Adobe Analytics
Session
Determine if cookies are active
s_hc
Adobe Analytics
Session
Cookie used by Adobe for analytical purposes
s_ht
Adobe Analytics
Session
Cookie used by Adobe for analytical purposes
s_nr
Adobe Analytics
2 years
Determine the number of user visits
s_ppv
Adobe Analytics
Permanent
Adobe Analytics plugin: getPercentPageViewed Determine what percentage of the page a user views
s_sq
Adobe Analytics
Session
ClickMap/ActivityMap features
s_tp
Adobe Analytics
Session
Cookie used by Adobe for analytical purposes
s_visit
Adobe Analytics
2 years
Cookie used by Adobe to know when a session has been started.
They allow the advertising shown to you to be customized and relevant to you. Thanks to these cookies, you will not see ads that you are not interested in.
The advertising is customized to you and your preferences.
Your choice means you will not see customized ads, only generic ones.
Name
Owner
Duration
Description
OT2
VersaTag
90 days
VersaTag Cookie used to store a user id and the number of user visits.
u2
VersaTag
90 days
VersaTag Cookie where the user ID is stored
TargetingInfo 2
MediaMind
1 year
Cookie that serves to assign a unique random number that generates MediaMind.
These cookies are related to general features such as the browser you use.
Your experience and content have been customized.
With your selection, we cannot offer you a continuously improved browsing experience.
Name
Owner
Duration
Description
mbox
Adobe Target
9 days
Cookie used by Adobe Target to test user experience customization.
×
Looks like you’re browsing from Mexico, so let’s show you the custom content for your
location. Change
Looks like you’re browsing from Spain, so let’s show you the custom content for your
location. Change
Select a country
In order to access the private area and corresponding sandbox, select the country of the APIs you want to use.