Data, data, data. Metrics, metrics, metrics. In the digital world there’s no other way to make decisions than by measuring how products work in real-time. An app is no exception. There are some useful metrics that can tell you whether the performance meets expectations: users’, behavior, use time, acquisition cost, average income, and more. There are many, and they vary depending on the app. If we’re not meeting our targets, we need to change. The only route to success is to test and not be afraid to change what doesn’t work.
Here are the five key metrics for assessing the result of an app:
1. Number of active users.
The number of active users is a metric primarily focused on volume. The goal is to achieve ever greater numbers. But it’s also important to measure the commitment these users show to the product, otherwise customers are very likely to delete it from their device. It’s the engagement of the end user that tells you most about the application.
If you’re using Google Analytics as a tool for measuring traffic, you can find the report that shows the number of active users on this path:
– Log in to Google Analytics.
– Click on the app view.
– Select “Audience” in the report.
– In Audience choose “Active Users”.
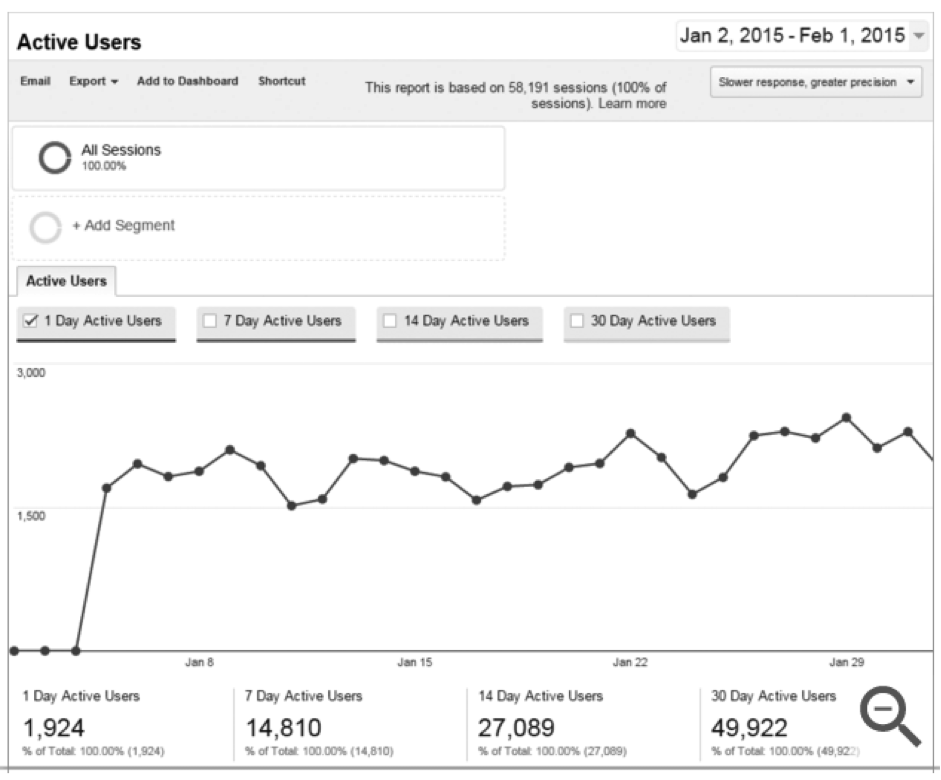
This report allows the developer to measure of four types of active users, always based on the last day of the time period selected. So imagine we choose a time slot from 1 January to 30 January:
– Active users in one day: number of single users that have logged onto the application that 30 January (last day of the period).
– Users active for seven days: same metrics from 24 to 30 January.
– Users active for 15 days: in this case from 17 to 30 January.
– Users active for 30 days: the whole month (1-30 January).
An important metric in terms of the number of users is the percentage of new users. Only if we have a constant flow of new users can we continue to raise the app’s growth ceiling. If the rate of new users slows down, this may be an alarm signal that might make us want to change the design and the user experience. For example, in publishing-type applications it’s essential to have a constant flow of new readers for the contents.
Google Analytics has a specific metric for measuring “New users”. It offers the possibility of creating specific panels to measure the total number of single users in a time period and shows which ones are new users and which ones are recurrent users. This metric is indispensable for measuring future success.
2. Average session duration.
This is an interesting metric measuring users’ real engagement, and particularly in the case of new customers with whom we will need to build customer loyalty to viralize the use of the application. Whatever our product, if we find many users are logging on and then immediately logging off again, it’s a very bad sign. Evidently the average session duration depends on the type of contents in the application: there are some products that are consumed rapidly and others quite the reverse.
Google Analytics has two important metrics for measuring the quality of each user’s session: “Interaction” (amount of time the users are logged on to the application) and “Frequency” (measures the number of logons on that period). In short: how many times they go to the app and how long they use it for. The two reports can be found at “Audience” > “Behavior”.
3. Reports on user behavior.
These reports give the development team a fairly approximate idea of the real functioning of the app and of the customers’ use, and offers data on the viewing order of the screens, the number of technical errors (for example the number of times the app crashes) or the load times of essential elements in the app’s interface. These reports are very useful.
What’s more, thanks to the creation of Events, we can measure micro-interactions (such as the process of signing up for a newsletter, when users add a product to their cart or download additional information to find out more…).
– Screen visualizations: this report contains information on the number of visits to a screen, single screen visits, and the percentage of exits from a specific screen on the app. This is a situation report.
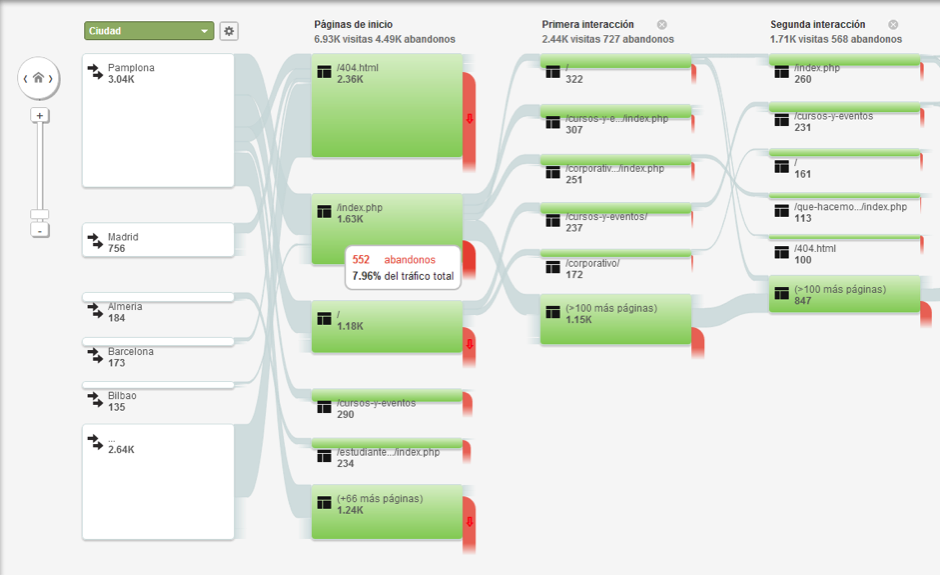
– Behavior flows: this report shows a flow diagram of the user’s movements through the app’s screens. It is very informative as it also contains other relevant data:
– Relative volume of traffic according to the dimension.
– Relative volume of users at each node in the path.
– Volume of traffic and percentage of abandonment between steps.
– The point on the path at which users backtracked along the path.
– Connections, nodes and exits by hovering over them with the cursor.
– Crashes and exceptions: this report allows the development team to see the name and description of the main errors in an application (network failures, searches without results and so on). Crashes, as these are a specific exception, are shown differentiated from the rest. To measure an app’s errors you need to retouch your tracking code. To do this, teams with technical knowledge have a SDK for both iOS and for Android
– Reports on the speed of the app: these allow you to know how long the different user requests take to run on the app. To see this information you need to make a special configuration of the tracking code, the same as with the exception reports. Developers also have a specific SDK for user times for both iOS devices and Android terminals.
– Events: this type of measurements register the small actions that do not trigger a change on the screen. Sharing a content on a social network does not trigger a change of interface in an app, but an additional action. Downloading a file is another example. To measure these micro-interactions we also need to change the tracking code of the app and the degree of customization is fairly high. We also have two specific SDKs both for iOS and for Android.
4. Attribution
Attribution model reports are important for establishing whether the investment in campaigns for downloading an app, for example, or for capturing users and traffic are successful, and what sources are most effective for that purpose. It’s normal practice to use social networks like Facebook or Twitter or online advertising platforms like Google Adwords to promote apps.
There are various types of attribution models:
– “Last interaction” attribution model.
– “Last indirect click” attribution model.
– “Last Adwords click” attribution model.
– “First interaction” attribution model.
– “Linear” attribution model.
– “Time decay” attribution model.
– “Position-based” attribution model.
5. Lifetime Value (LTV)
The lifetime value of a customer is a really important metric for quantifying the real value of the app. This is the amount of income generated by a user in their use of the app. This metric not only shows its monetization capacity, but also the user’s engagement with the product .
How to configure Google Analytics to measure the LTV? It’s not straightforward. There are some very practical step-by-step tutorials for making the implementation:
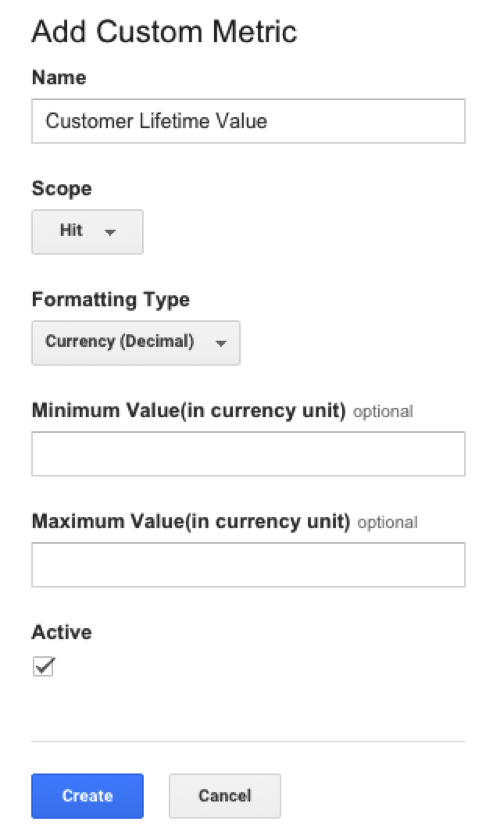
– Creating the custom metric in GA: in the Google Analytics administrator select Property < Custom definitions < Custom metrics. This is where you create your own metric for the LTV.
– Using Google Tag Manager to change the tracking code: you need to enter a single line of code to start measuring the end result of each purchase on the app, and the type of product and the value of each of these transactions. Google Tag Manager makes it really easy to add new tracking tags to an app. In this case, a variable is created to capture the value of each transaction that occurs on the eCommerce app. 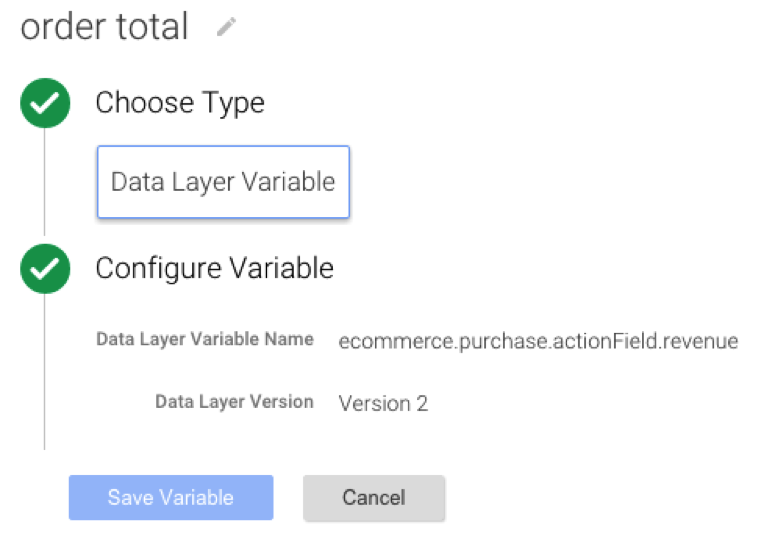
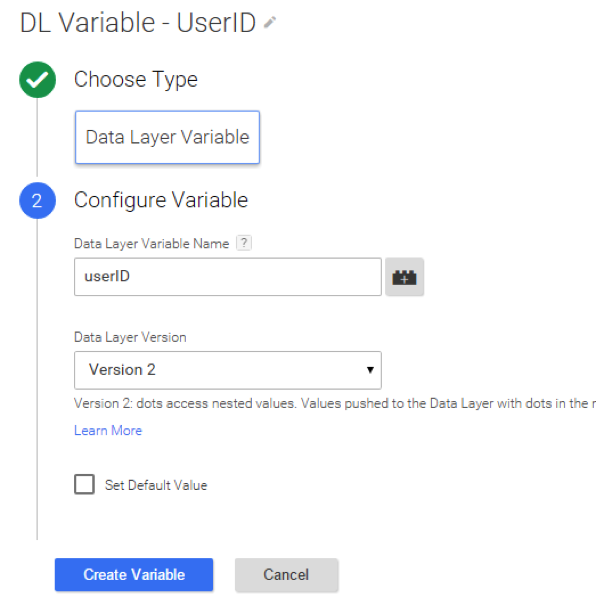
– Associating each transaction to the user ID: once the custom LTV metric has been defined, we need to know which customer made each purchase. To do so we can use the ID elements in any company’s CRM and create a User-ID variable with Google Tag Manager.
Follow us on @BBVAAPIMarket